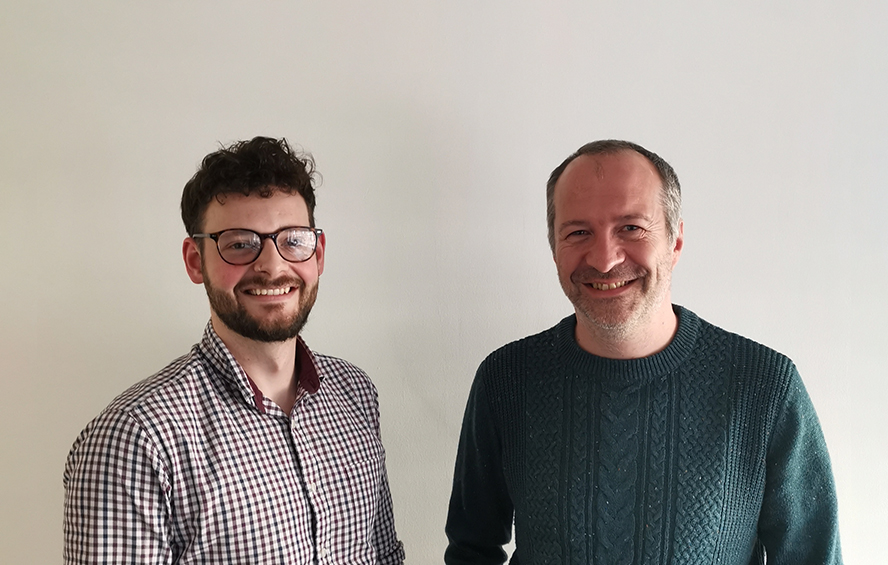
Our head of sales and business development, Dr Steven Dodd, was recently invited to introduce the basics of 1D image analysis to students at the National Horizons Centre.
Below we’ve summarised some of the key takeaways from that lecture that demonstrate how our software can support faster and more reliable analysis of 1D gels and blots.
You don’t get your results from your experiment… you get it from the picture of your experiment!
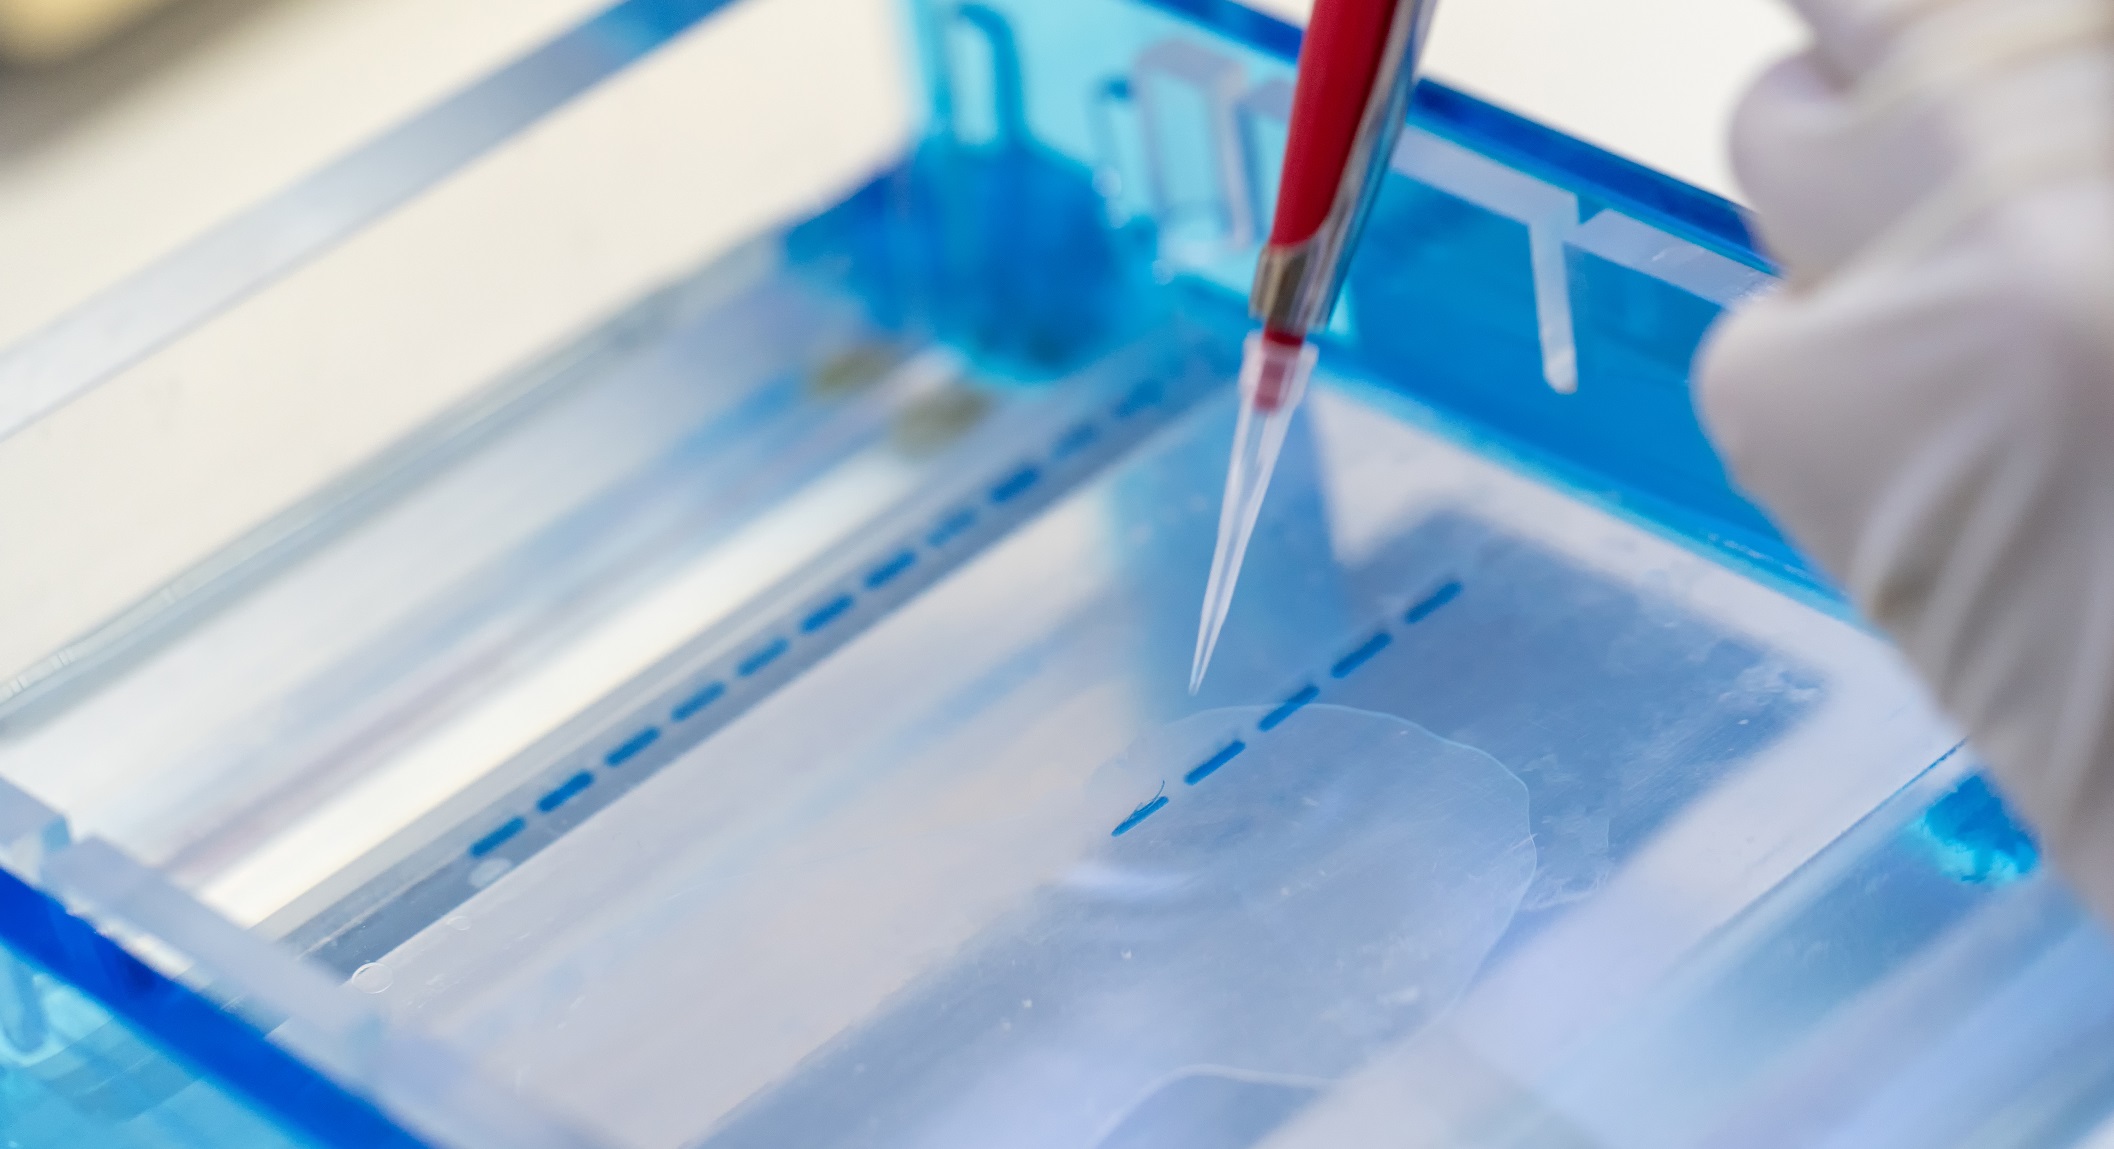
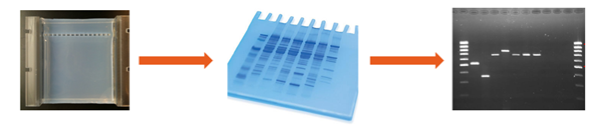
At some point during your experiment, you’ll undoubtedly use some form of stain, which binds to your biomolecules and allows you to visualise them within the gel.
Once at this stage in your experiment you’ll need to use some form of gel documentation device to accurately image the gel and turn it into a digital file. It is from this digital format – the picture – that you will be able to perform measurements to allow you to obtain quantitative experimental data.
Not all gel documentation devices are made equal.
To ensure the accuracy and reliability of your results it’s important to consider which gel documentation device you wish to use to image your experiment.
The most basic form of gel documentation devices are densitometers, like the Bio-Rad GS-900, which look very much like a very specialised flatbed scanner.
The next bracket up of gel documentation devices are what you would usually see in a lab, for example a Cytiva Amersham ImageQuant 800. These devices consist of a darkroom with a stage and a high-end digital camera at the top.
Within these devices are typically a few different, highly specialised light sources that illuminate the gel with specific wavelengths of light. These allow you to use a much wider range of dyes than a densitometer and even multiplex your experiments.
The top-of-the-range instruments, examples being the Azure Sapphire Biomolecular Imager or the Cytiva Amersham Typhoon, have the most accurate scanning and illumination technologies available including laser excitation and multiple image capture detectors such as combinations of CCD cameras and photomultiplier tubes.
It is therefore crucially important that you critically evaluate your gel documentation device choice to make sure it has the necessary features and the highest possible resolution for image capture that fits within your budget.
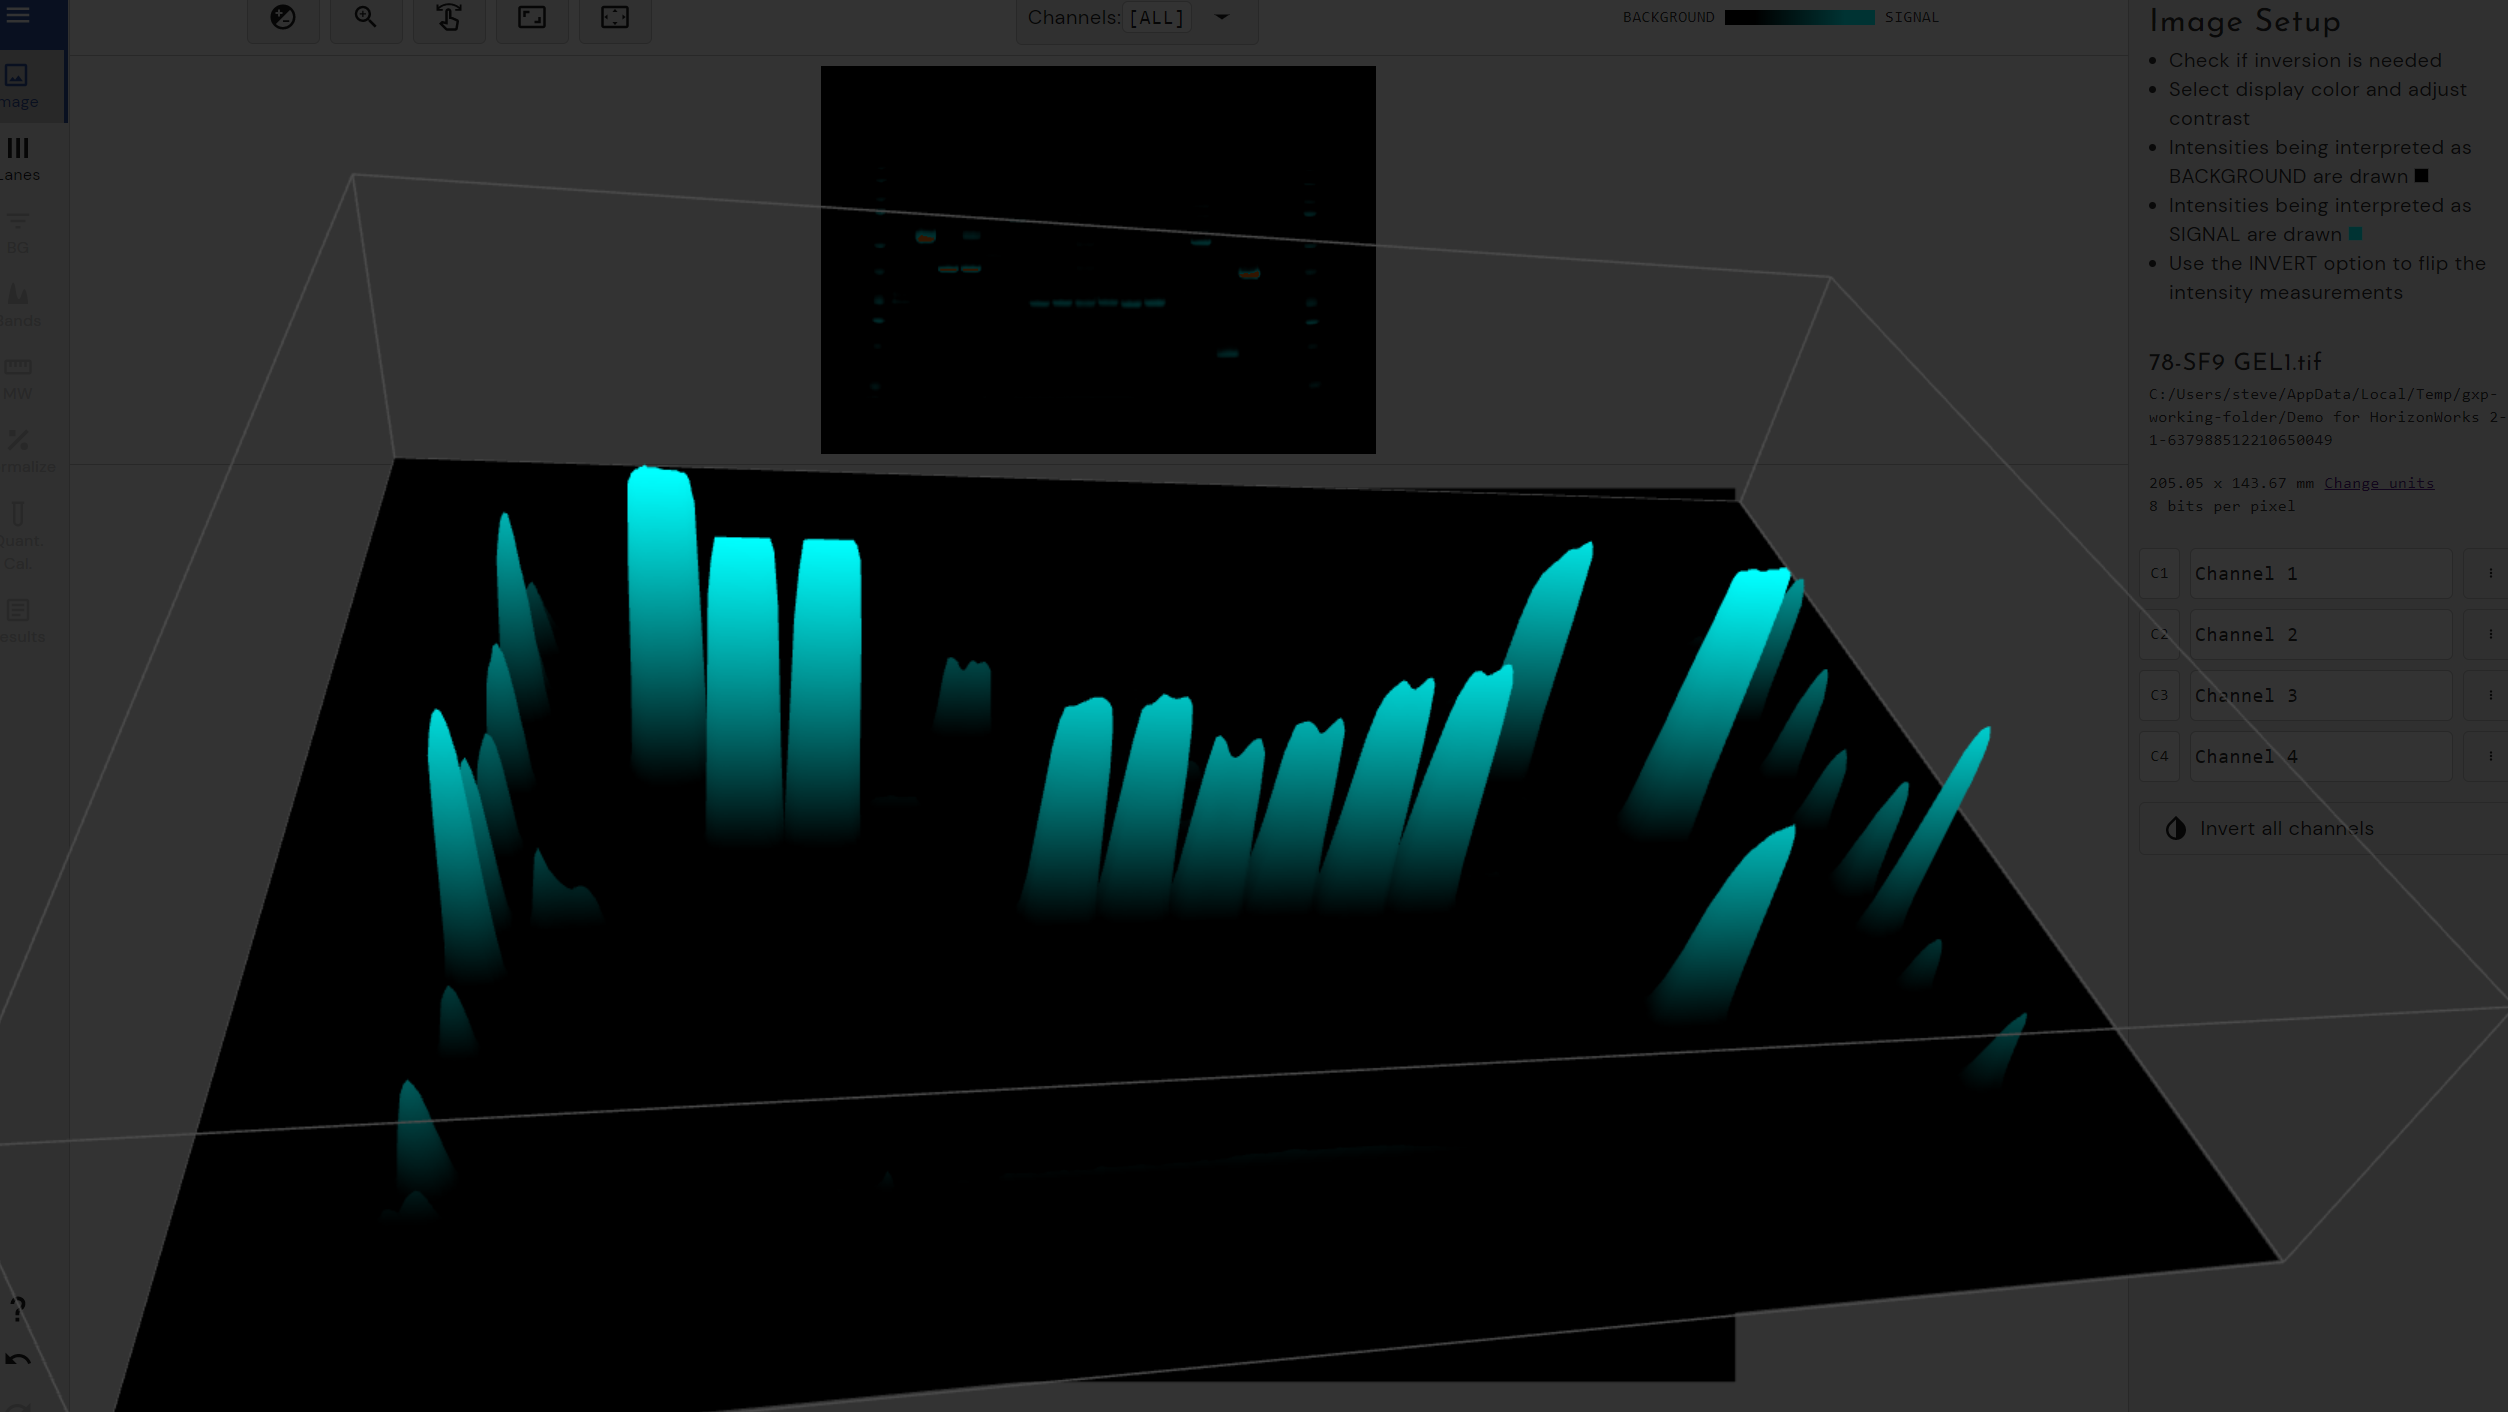
Converting images into experimental data
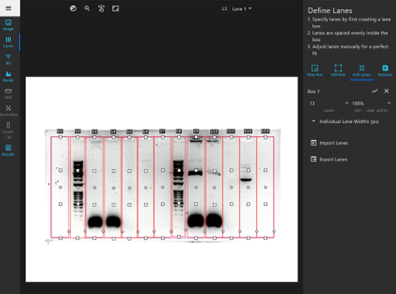
The first step is to identify the lanes within your gel or blot. Band detection can then be performed either manually or automatically, depending on the analysis software used.
Within our 1D software, this is easy to do by simply clicking and dragging lane markers onto the gel. These lane markers are fully adjustable to account for any warping of lanes that may have occurred during your experiment, making sure you can get accurate quantification data from even the poorest of gels or blots.
The lane markers inform the software where to look to automatically detect your bands. This saves operator time and provides greater inter-operator reproducibility. Users are also able to tweak the sensitivity settings of the automatic band detection algorithm or perform band detection automatically to fine-tune their analysis.
You can then use software features to further analyse your data and create reports which can be easily exported to Excel for further manipulation.
Also, as our software is universal and works with the industry-standard .TIFF image format, laboratories aren’t tied to one equipment manufacturer for image analysis.
In the previous equipment examples (the Cytiva Amersham ImageQuant and the Azure Biosystems Sapphire Biomolecular Imager) you will actually find TotalLab software.
As the industry leader in 1D and 2D image analysis software, we regularly form partnerships with equipment manufacturers who wish to use TotalLab’s decades of experience within the field to empower their own products.
We also provide a 21 CFR/21 CFR/GMP compliant version of our 1D software to enable those working in regulated environments (drug manufacture, medical devices, raw material quality control, biotech, CMO, CRO etc.) to adhere to 21 CFR Part 11 and achieve FDA compliance or for more general auditing purposes.
You can find out more about our software solutions here and if you’d like to explore our 1D gel image analysis software, contact us for a free demo.