
A guide to using SameSpots
The SameSpots analysis workflow allows you to analyse 2D gels with any type of staining including DIGE and secondary protein stains.
In this article you will discover the key steps of the SameSpots workflow, and read about SpotCheck, which will help ensure that your 2D gels meet the quality requirements of your lab.
Image QC
When using SameSpots your images go through a process of image quality assessment. Feedback is also provided to help you to optimise image capture – which is vital for accurate image analysis.
Any positional errors introduced during scanning can be corrected using in-built tools (flip, rotate, invert) without interrupting your analysis workflow and images can be cropped if required before proceeding with the analysis.
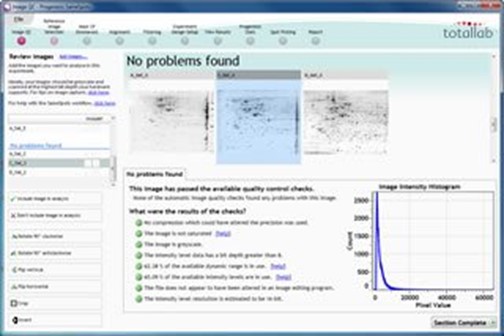
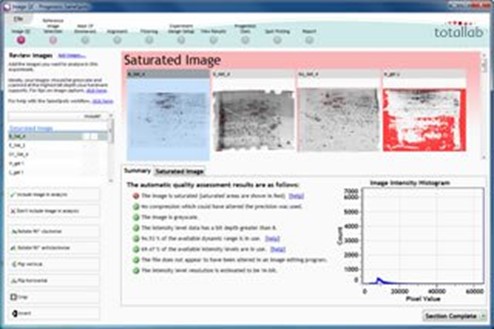
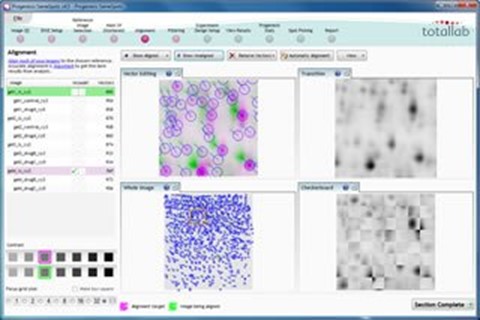
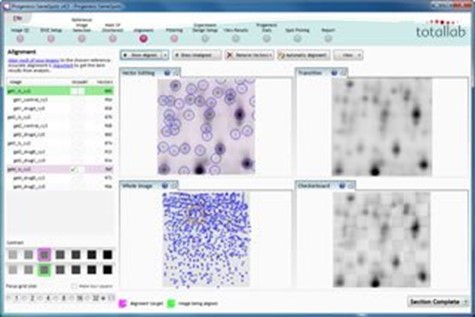
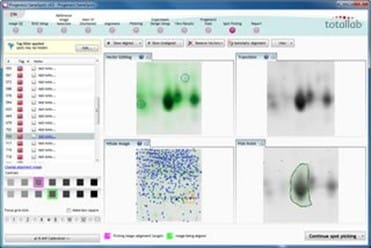
Image alignment
This simple-to-use visual tool produces automated and highly accurate image alignment. The images are perfectly aligned at the pixel level, which enables 100 per cent matching and no missing values when the experiment is analysed.
Automatic analysis
You can complete analysis of a whole experiment in this single step, which takes only minutes per gel. This incredibly rapid process includes SameSpots detection, background subtraction, normalisation and matching.
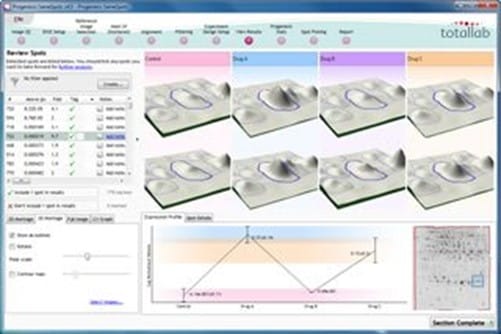
Review results
SameSpots presents statistically ordered lists of spots for all the experiment designs you set up. Spots are ordered by ANOVA p-value and given a unique ID which is maintained if the experiment design setup you are viewing is changed.
In most cases you won’t need to edit the analysis, but if some spot editing is required, you edit on a single image and the effects are applied across all images in the experiment.
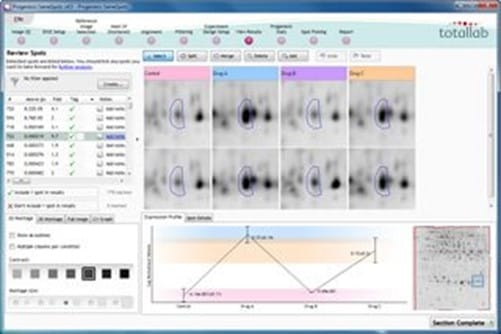
Statistical analysis
SameSpots Stats is a simple-to-use tool that allows you to easily apply powerful statistical analysis and make reliable conclusions.
Principal Components Analysis (PCA), Correlation Analysis, Power Analysis and q-values (false discovery rate adjusted p-values) are included to explore the trends in your data.
The tests enable you to measure:
- How your data clusters within your experiment. This can validate the hypothesis used to create the experimental groups and indicate any outliers in your data
- How similar spots are in terms of their expression profile. This can help you find additional drug targets or other proteins involved in processes related to the one you’re studying
- The power of your experiment. This will tell you if you’ve run enough replicates for valid results and is becoming a requirement for publishing research
Any spots you select as being interesting from these tests can be mapped onto a whole gel image to show their location for further validation.
pI & molecular weight calibration
With SameSpots, you can quickly calibrate spots against either a molecular weight ladder or known proteins. The image can be tagged with MW and pI values and calculations are updated on the fly as marker points are added.
You can view imported protein identification results and cross check against your markers to confirm their accuracy.
Spot Picking
The unique alignment allows you to align an analysed image to a picking gel and create highly accurate spot picking.
The workflow supports manual picking, those using the GelPix, ProPic™ and Ettan™ spot cutting robots and there is also a generic robot option which outputs the spot picking coordinates.

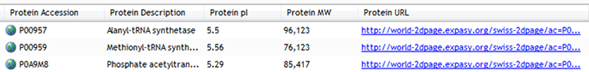
Import Protein IDs
If you have identified proteins using Mascot, or have your search data as a .csv file, you can import results back into SameSpots linking identification data to the spot from which it originated.
This gives you a complete view of your experiment and helps put results into biological context. Identifications are integrated into the SameSpots results tables and can be viewed on the whole image view.
Publish and share your results
As you work through your analysis, images and tables can be added to the clip gallery with a simple right click. You also have the option to add some notes for future reference.
The report at the end of the workflow provides an overview of the protein spots you defined as significant or selected for picking.
The printable report can be saved for future reference and is a quick way of sharing your results with colleagues.
SpotCheck gel QC workflow
SpotCheck is a separate QC workflow within SameSpots which allows you to quickly and objectively measure whether a 2D gel meets your lab’s quality requirements.
Whether you use SameSpots for your 2D analysis, or another software package, you can follow this simple workflow to check the quality of all your gel images.
Once you’ve created a gold standard, you can test unlimited gels against it free of charge.
Steps in this process:
- Create a gold standard experiment
This is a high quality, single sample experiment with associated stringency requirements. SpotCheck will use your gold standard as a baseline to objectively measure the quality of your gels. - Import test image
Your images go through a process of automatic image quality assessment with feedback to help you optimise image capture – vital for accurate image analysis. - Align test image to gold standard experiment
The test image is automatically aligned to the gold standard experiment. - Image passed or failed the QC check
You get an immediate pass or fail assessment and a colour coded whole image view to show you which spots passed, and which spots failed. A group of spots which failed in a certain area of the gel may help you troubleshoot your gel running.