SpotMap - Examples and Evidence

Examples and Evidence
We work closely with our customers from across the globe to ensure they get the best from SpotMap.
To help you to evaluate SpotMap for your projects we can provide you with a demonstration of the software using your own images and fully support you throughout a free trial of the software.
Below is a small sample of reports, posters, application notes and more demonstrating the use of SpotMap. Click to open the full .pdf document.


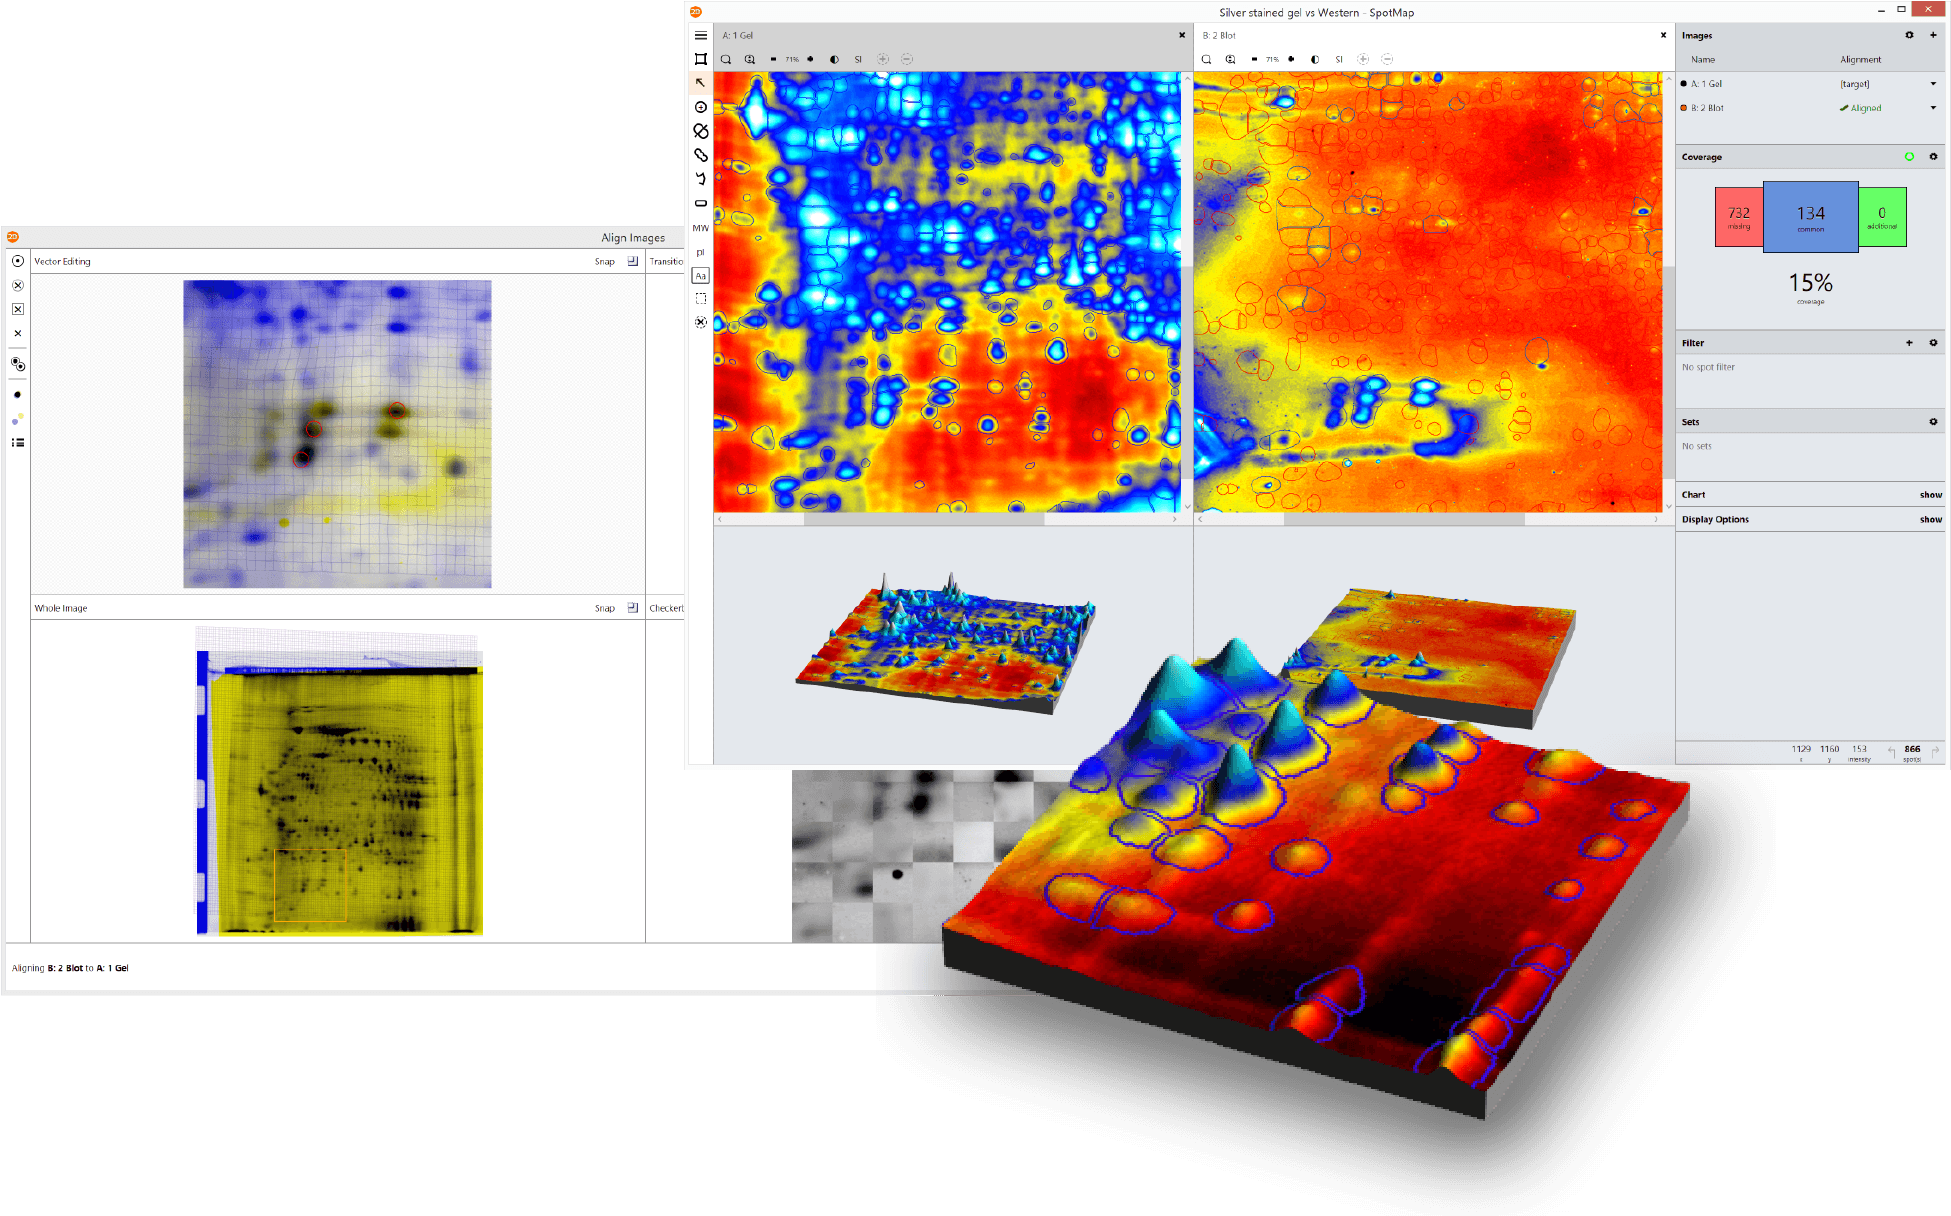
Example analysis report: SpotMap analysis of a 2D gel vs Western blot
The images used in this analysis were challenging to analyse due to low colour depth, presence of saturation, non-spot features and steaking on the blot image. Issues such as these are commonly experienced in the analysis of 2D gels and Western blots. SpotMap provided results quickly, within an hour, to calculate percentage coverage of the 2D gel by Western blot as 17% following identification of 709 spots.
Technical note: Removal of positional variation using alignment.
Alignment is a key feature within SpotMap. It removes positional variation between images to allow direct comparisons of spots present on different images to be made.
In this analysis the use of two different alignment targets were compared. In one analysis the Western blot was aligned to the gel. In the other analysis, both the 2D gel and Western blot were aligned to the stained membrane of the Western blot.
14% coverage of the 2D gel was recorded following both methods of alignment.
Application note: Anti-HCP antibody characterization using SpotMap
SpotMap was used to characterize two pooled samples of antisera by comparison of Western blots to a 2D gel.
Percentage coverage of each pooled antisera was calculated and spots recognized were compared. Pool 1 antisera had a broader reactivity at 44% coverage, compared to 39% coverage by pool 2. Comparisons of low and high molecular weight regions were also made. Pool 1 had lower coverage in the low molecular weight region.
Case Study: University of Aberdeen, Proteomics
The Proteomics core facility is based at the Rowett Institute but operates as part of the University of Aberdeen. They are using SpotMap in their lab. Read what they think about it here.
2D-SDS PAGE analysis methods for determining HCP Coverage using process derived anti-HCP polyclonal antibodies
A silver stained 2D gel was compared to a Western blot captured at 3 exposure times of 1.0, 3.2 and 5.5 seconds. Analysis was completed using PDQuest and SpotMap, the workflow of each software program and percentage coverage results were compared. Analysis using PDQuest took approximately 3.5 hours and provided percentage coverage results in a range of 11% across the three exposure times. SpotMap analysis took approximately 1 hour and provided percentage coverage results in a range of 1% across all exposure times.
Inter-user variation of percentage coverage is within a range of 2% using an optimized analysis process
Three analysts with a range of experience from novice to expert, used SpotMap to analyse 3 data sets to obtain percentage coverage with a range of easy to challenging.
SpotMap software used to minimise inter-user and inter-lab variation of anti-HCP antibody percentage coverage results

Four analysts from two locations with a range of experience using SpotMap analysed two data sets and the percentage coverage results were compared. The coefficient of variation for each analysis was within 10%.
Originally presented at WCBP 2016.
Host cell protein coverage example analysis report based on images donated by University of Cambridge
A full analysis was performed and a report was generated using SpotMap in under an hour including an audit trail to support 21 CFR Part 11 compliance.


