
2D-SDS PAGE Analysis Methods For Determining HCP Coverage Using Process Derived anti-HCP Polyclonal Antibodies

2D-SDS PAGE Analysis Methods For Determining HCP Coverage Using Process Derived anti-HCP Polyclonal Antibodies
Process-related impurities from host cell proteins (HCP) can potentially contaminate large molecule biopharmaceutical products such as therapeutic monoclonal antibodies and elicit a negative immune response from patients. As such HCPs need to be identified and monitored throughout the drug development and manufacturing process to ensure efficacy of drug substance as well as to prevent any untoward health issues in patients. Clearance of HCPs through downstream purification is required to produce safe and efficacious therapeutic proteins. To investigate the presence of residual contamination with HCPs during the bioprocessing purification stream and in the final biopharmaceutical product, the development of customized polyclonal antibody reagents with maximum coverage against native HCP extracts is required.
In the development of an HCP antibody, the immunogenicity and abundance of individual HCPs can vary widely presenting a unique challenge. Validation of the HCP antibody at every step of development is key to ensure good coverage. The implementation of two-dimensional (2D) SDS-PAGE assessment, by which complex protein mixtures are separated according to isoelectric point and molecular weight followed by western blotting, can deliver additional insight into the capability of an anti-HCP polyclonal antibody. Here we present the characterization of a process specific anti-Pichia pastoris HCP antibody using 2 different analysis platforms: Biorad’s PDQuest and TotalLab’s SpotMap. The ultimate goal of performing 2D SDS-PAGE is to determine the coverage of the anti-HCP polyclonal antibody in a sample of HCPs. A higher percentage of coverage indicates that HCPs are being recognized by more anti-HCP polyclonal antibodies. These anti-HCP polyclonal antibodies can in turn be used to purify drug substance of a HCPs at appropriate points in the developmental process. The aim in 2D SDS-PAGE analysis is to utilize an analysis software that is straightforward and consistent in providing coverage data over a varying set of exposure times.
Conclusions:
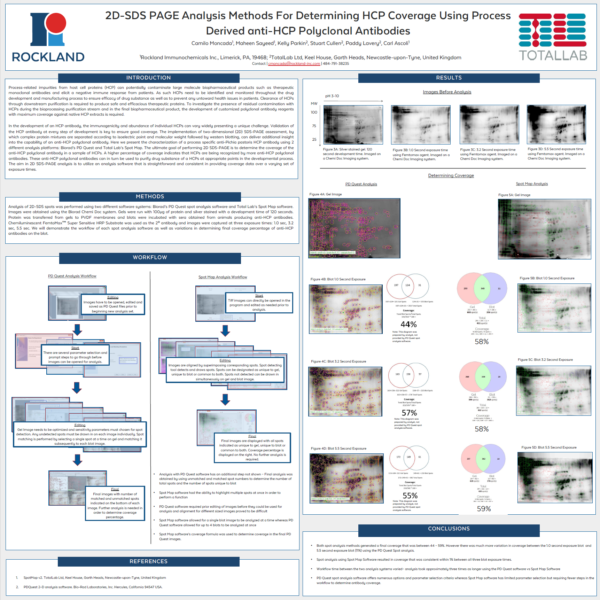
• Both spot analysis methods generated a final coverage that was between 44 – 59%. However there was much more variation in coverage between the 1.0 second exposure blot and
5.5 second exposure blot (11%) using the PD Quest Spot analysis.
• Spot analysis using Spot Map Software resulted in coverage that was consistent within 1% between all three blot exposure times.
• Workflow time between the two analysis systems varied– analysis took approximately three times as longer using the PD Quest software vs Spot Map Software
• PD Quest spot analysis software offers numerous options and parameter selection criteria whereas Spot Map software has limited parameter selection but requiring fewer steps in the
workflow to determine antibody coverage
Work performed in collaboration with Rockland Immunochemicals