DNA Fingerprint Analysis and Gel Matching Software

Click Here For Your Free Trial!

Advanced Band Matching Algorithms for Reliable Analysis

CLIQS 1D Pro allows you to perform large dataset investigations in a fast and easy to use interface. Using advanced algorithms and accurate band-matching capabilities, CLIQS 1D Pro helps users quickly and easily identify and match DNA/RNA or protein bands of interest across even complex 1D SDS-PAGE gel and immunoblot images. The software also includes next-generation tools and features, such as automatic lane and band detection, background subtraction, and 1D gel lane normalization. It’s a complete tool for DNA fingerprint analysis – single software installation with no additional modules or databases to setup.

The software is incredibly powerful as it allows a completely flexible approach to matching. Each individual lane can be compared to any other lane within the database. The matched results across many gels can be presented as a dendrogram or tables that show band and lane similarities. It’s also incredibly quick and easy to train new users.

CLIQS 1D Pro can be used to analyze a variety of research techniques including (but is not limited to):

      • DNA Fingerprinting
      • Pulsed-Field Gel Electrophoresis (PFGE)
      • Denaturing Gradient Gel Electrophoresis (DGGE)
      • Restriction Fragment Length Polymorphism (RFLP)
      • Enterobacterial repetitive intergenic consensus (ERIC)-PCR results
      • Single-Strand Conformation Polymorphism (SSCP) Fingerprinting
      • Automated Approach for Ribosomal Intergenic Spacer Analysis (ARISA)-PCR
      • Amplified fragment length polymorphism (AFLP)
      • Inter simple sequence repeat (ISSR)-PCR
      • Lateral flow test (LFA/LFT) image storage, databasing and cross-referencing/matching

CLIQS 1D Pro is trusted by the world’s leading pharmaceutical, governmental and academic institutions:

Excellent software for the study of SSCP gel fingerprinting. Thanks to its characteristics we have been able to estimate the diversity index and similarity profile of our samples, we have also obtained the different matrices generated by the software. This software is easy to use and very intuitive; this fact is very important and difficult to find in similar software.

Matteo Evangelisti, Ph.D
- Universita Tor Vergata, Italy

Identify lane relationships across many 1D based experiments

Our software allows you to easily visualize your matching results using dendrograms or phylogenetic trees, which allow the study of relationships between the different samples lanes stored in your database.

Clustering lanes using dendrograms allows you to study the relationships between lanes stored in the database. These dendrograms are easy to create from band matching results. Once built, the dendrogram is scalable and fully interactive, to allow a flexible presentation of lane relationships. The dendrogram also allows you to create groups of related lanes that can then be reported on in a cluster table.

CLIQS 1D Pro is currently used in the following fields of research:

      • Population Genetics
      • Sample Strain Analysis
      • Cultivar Experiments
      • Evolutionary Biology
      • Ecotoxicology
      • Microbiology

Our research focussed on the role of bacteria and fungi in sustainable agricultural practices. This required comparing bacterial and fungal communities in different types of crop rotations, fertilizer treatments and irrigation regimes. The main problem faced by the researchers was handling distortion in gels that were run and pooled. Even when gel images were acquired, analysis was difficult due to hard-to-use software, software that only used proprietary image formats or software that had limited analytical capacity. CLIQS 1D Pro provided a versatile tool to analyse all types of images and quickly and easily compare images from different experiments.

A collaborative study between the Environmental Sciences Institute, Florida and the University of Florida

Classify unknown samples using your own experimental database

Lanes containing unknown samples can be matched against a defined reference library of identified samples. Maintenance of the library is very straightforward, and it can be easily shared with co-workers to facilitate collaboration on large projects. This is especially useful in projects based around food security and verification to ensure that the meat content of foods entering the supply chain is from the species claimed for example.

Analysis of pulsed field gel electrophoresis (PFGE) images is ethe gold standard in the tracking of food and waterborne disease outbreaks, emerging pathogens, and acts of bioterrorism. CLIQS 1D Pro is fully compatible with the work done at PulseNet International to track such infections or outbreaks.


1D SDS-PAGE Band Similarity Matrix

Our study has demonstrated that using the Agilent 2100 bioanalyzer with the Phoretix system offers a standardized, objective method for rapid varietal discrimination. The ease of use and total analysis time of less than 50 minutes makes it most suitable for mill intake use. The optimized system will enable millers to make more confident decisions in accepting grain consignments, and could become widely adopted as an effective policing tool within the grain industry. A number of UK mills have purchased the combined systems for screening wheat deliveries at intake

Dr Dhan Bhandari
- Campden & Chorleywood Food Research Association (CCFRA), UK

CLIQS 1D Pro workflow

CLIQS 1D PRO allows you to measure relationships between hundreds of samples quickly and easily using a guided workflow. You are taken step-by-step through how to detect lanes and bands, store the results in a simple database and compare band-patterns. CLIQS 1D Pro has been developed for strain analysis using techniques such as DGGE, RFLP and PFGE and DNA fingerprinting.

Image pre-processing:

  • Invert colors
  • Flip, crop and rotate
  • Optimize contrast and brightness

1D Electrophoresis Image editor


1D SDS-PAGE gel quantification:

  • Automatic and manual lane creation
  • Background subtraction to remove noise
  • Detect bands automatically
  • Molecular Size calculation
  • Gaussian fit to bands
  • Quantity Calibration
  • Normalization

CLIQS automatic lane detection

Comparing and clustering samples

  • Next-generation rf calibration correction algorithms to compensate for gel running differences
  • Analysis of multiple gels to identify and compare banding patterns
  • Manage different lane sets within a single database
  • Generation of a dendrogram to clearly identify sample relationships

1D SDS-PAGE band matching

Classification of unknown samples

  • Rf calibration to allow for gel running differences
  • Creation of a user defined library of known samples and respective banding patterns from multiple gels
  • Comparison of unknown samples to this library to identify the closest known sample

1D SDS-PAGE Band Similarity Matrix

Export and share results

  • Annotate images
  • 3D view
  • Clip Gallery to capture publication quality images
  • PDF analysis reports
  • Export data tables to Excel .CSV file

1D SDS-PAGE Dendrogram Analysis


Case Studies

Case Study: University of Florida

In this collaborative study, we are studying the role of microbial communities, mainly bacteria and fungi in sustainable agricultural practices. The study also aims to establish how microbial communities can be used as indicators of success in sustainable agriculture settings and plant disease management. To achieve these objectives, bacterial and fungal communities in different types of crop rotations, fertilizer treatments and irrigation regimes were compared.

“By combining ARISA-PCR with this software, we have a versatile tool that can analyze all types of images, allowing the comparison of images from different experiments; it is very quick and easy to use. More importantly it allows me to easily export the data matrix for further statistical analysis.
This means our images are no longer just visual, but, we can extract data that can be used in statistical tests.”

“In our case using ARISA (on an Agilent Bioanalyzer platform) and TotalLab’s CLIQS 1D Pro software has enabled us to perform robust experiments. My advice for any interested user is simple; download the fully functional trial version, try it and you will be impressed. A search of the impressive list of scholarly articles that cite the software will definitely inform you of its ability.”


Case Study: Royal Society for Public Health’s CCFRA Food Research Association

Rapid wheat varietal identification using the Agilent 2100 bioanalyzer and automated pattern-matching

Established in 1856, Royal Society for Public Health (RSPH) is an independent campaigning and educational charity dedicated to improving and protecting the health of the public – both in the United Kingdom and around the world.

“Our study has demonstrated that using the Agilent 2100 bioanalyzer with the CLIQS 1D Pro system offers a standardized, objective method for rapid varietal discrimination. The ease of use and total analysis time of less than 50 minutes makes it most suitable for mill intake use. The optimized system will enable millers to make more confident decisions in accepting grain consignments, and could become widely adopted as an effective policing tool within the grain industry. A number of UK mills have purchased the combined systems for screening wheat deliveries at intake.”

References

Our CLIQS 1D Pro software has been in active development since the early 2000’s and in that time has been cited numerous times in academic publications:

FAQs

Can I install on a machine with no internet connection?

Yes! all TotalLab software can be activated completely offline and does not need to connect to the internet to maintain the license to facilitate our customers with stricter security requirements in the pharmaceutical industry

Can I use the software on multiple computers?

A single electronic license is tied to one computer, however you can have unlimited Windows accounts on that computer with access to the software. If you do require multiple licenses for multiple different computers or for staff working from home, please let us know using our contact us form and we'd be happy to apply a favorable discount for multi-license purchases.

Which Operating Systems can I use?

CLIQS 1D Pro is compatible with and fully tested under Windows Vista, Windows 7 and Windows 8 and 10, 32 and 64 bit versions.

I have further questions. Can I have a demonstration?

Yes we can organize an online demonstration with a member of our team if required. If you have your own images already then they can be used in any analysis we do. We are always interested in our customers questions and workflows.

Why does Automatic Lane Detection fail on my gel?

There could be a number of reasons this happens. It could be because

- The lanes are short or have very few bands

- The lanes are too close together so the algorithm cannot split them

- The lanes are not quite the same width which is an assumption the algorithm uses

- The resolution of the image is very low and there is not enough band information, using an AOI for lane detection can help (just draw a box when in automatic detection mode) or simply try to create the lanes manually.

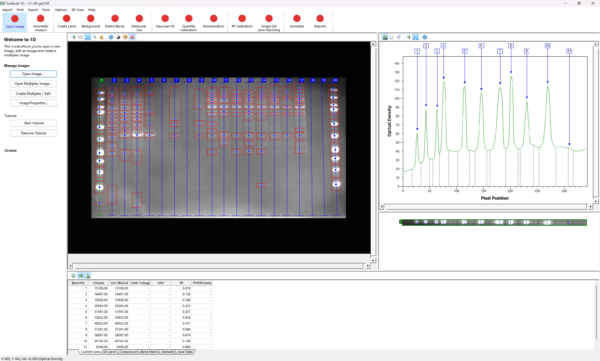
How does Molecular Sizing work?

Each lane has its own calibration curve calculated from where the iso-molecular weight lines(yellow) cross the center of a lane. With only one standard lane these curves are usually the same as the lines just run horizontally across the gel. However with more than one standard lane it joins up the bands of the same value and so the lines can be slightly off horizontal depending on the gel.

Why use different curve types?

The default curve fit is cubic spline. This curve type creates a smooth curve passing through all points. It has no defining equation. This option can be somewhat over sensitive to inaccurate mappings but will guarantee that the results are as expected from where the iso-molecular weight lines(yellow) cross the lanes. First order Lagrange is similar but uses straight lines.

The other main option used historically is the Linear Log equation which is a straight line calculated from the log of the Molecular Size. This is theoretically correct but can lead to misleading results due to any inaccuracy of the curve fit. Even curves with high R2 results can still have problems.

What is the name of the curve fitting algorithm?

We use an iterative algorithm called Levenberg-Marquardt to get the results for the curve fitting equations. Cubic Spline and First order Lagrange are also well-defined algorithms.

My image does not look like the image I captured. Why?

On image load, a histogram of all pixel values is created. Then the default auto contrast is created from the value of the histogram after 0.5% of all pixels and at 99.5% of all pixels. This stops outliers or scanner noise affecting the result, but it can look a little different.

If the image has been calibrated or an uses an encoding (from Cytiva or Fujifilm manufactured scanners) then the converted values are used by default for the image. If you do not want this, then use the “Raw” option to go back to the raw pixel values.

Note: Contrast does not affect the values used in any calculations.

My lane profile is upside down. What can I do to fix it?

Go to the File menu and select Invert Measurements to reverse the calculation used to generate the Profile. This option is remembered so you should not need to change it again.

What file formats can the software support?

The software can load in .tif, .tiff, .jpg,.jpeg, .png, .gif, .gel, .img (Fuji), .bmp files.

When I load in my JPG file the image is inverted

This occasionally happens as part of the loading function. Just press the invert button on the toolbar to see if reversed again.

What is Band Volume?

This is defined as the total value of all the pixels in a band with background subtracted. The pixels are shown on the image as between the 2 red lines (the band edges). Another way to look at it is as the area under the profile for the band (with background subtracted) multiplied by the lane width.

Where can you get the total volume of all the bands in a Lane?

This information can be found in the Analysis Report (previously called Gel Report). On the first page total band volume (and total lane volume) are displayed in a summary table of all the lanes in the gel.

What is Profile Deconvolution?

This option allows the user to model each band as a gaussian and use these to recalculate the band volume. This is sometimes used to split the volume of overlapping bands in what is believed to be a more accurate manner. Advanced fitting is best but there are problems. They are firstly, that is can be very slow and secondly, without good background subtraction they can be very wrong.

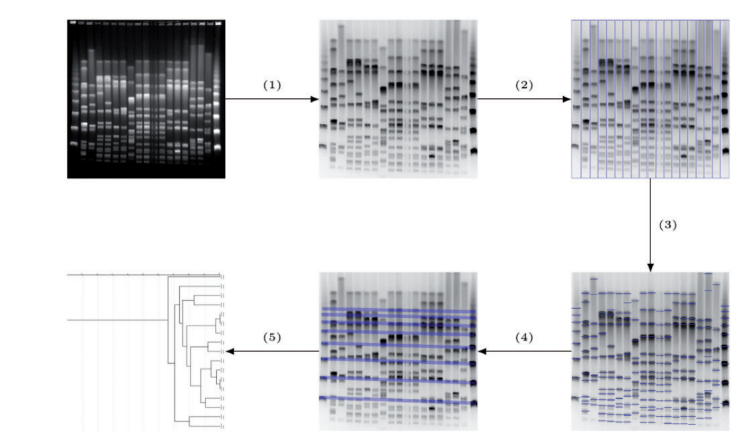
How do I export images/dendrograms in CLIQS 1D Pro?

To do any exporting to the clipboard or to file just right click on the image to bring up a context menu then choose the function you require.

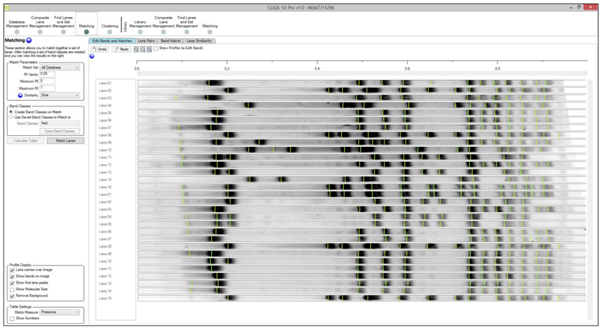
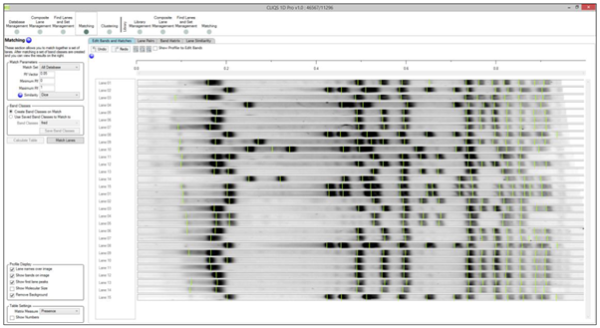
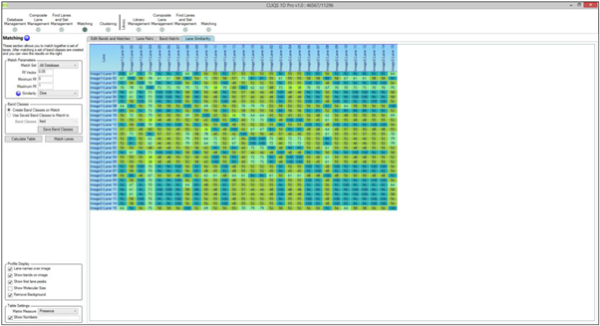
What is the normal procedure for using Rf lines to aid matching?

Use the same marker lanes in every gel (or common bands across the gels)
Put an Rf line on each marker band you wish to use and adjust for any smiling (you do not need to use an Rf line for all marker bands)
Edit the number of the Rf line so they are consistent between gels
Make sure the 0 and 1 marker lines are either in consistent places on each gel or removed so that the values are extrapolated from the other Rf line

I cannot move my Rf lines?

This may be because they are too close to each other. There is a limit to how close they can be and on low resolution images you may not be able to move them close to each other.

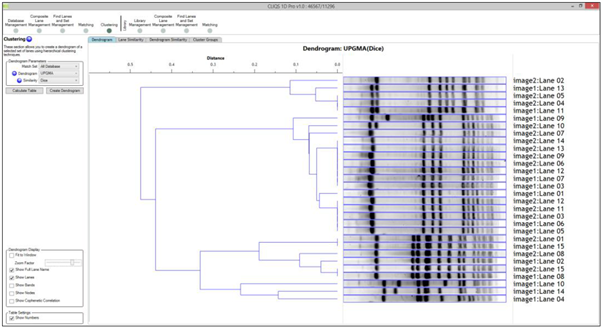
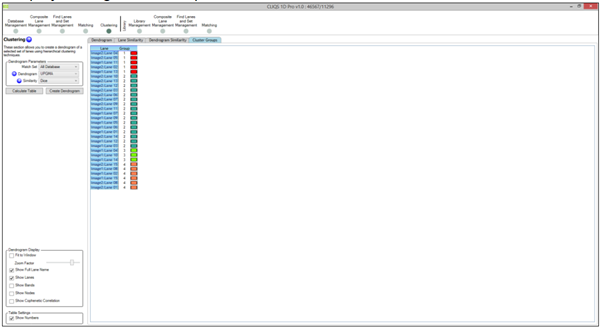
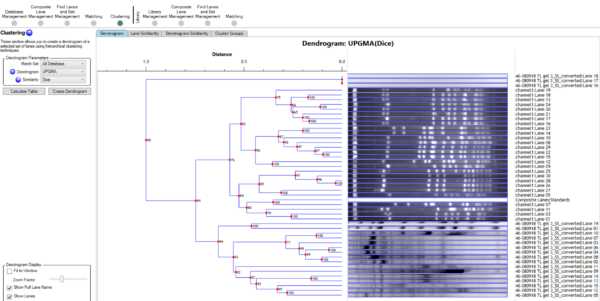
In 1D can I select which lanes to do a Dendrogram on?

Yes. Standard lanes are not matched by default and they would not be in a dendrogram (they can also be matched if required). Also, you can use Lane Selection in the Options dialog to switch off some lanes if you wish.

My profile is flat at the baseline, but I can see some background on the image?

This is probably due to Intensity Calibration errors. If your calibration curve intersects the y intersect at too high a value, then all raw values under the y intersect value will be calibrated to zero. This can lead to the background and some lane material showing as zero. Recalibrate the curve to improve your results or force it to go through the origin.

How many lanes can be stored in a database/library?

The limit is only based on RAM and disk space. We have loaded 500 in simple tests and they should cope with >1000.

Can more than one person access the database at the same time?

As many people as they like can access the database at the same time though it has not been designed for this type of use. However, if one user adds lanes to a database/library or changes bands then the other users may not get to see the changes straight away unless they load the database back in. So if you are careful it should be fine.

What is the BSI?

BSI is short for Band Sharing Index. It is calculated as (2*number of bands matched)/(total number of bands in both lanes) So for example two lanes have 5 bands and 7 bands. 3 bands are matched in each lane so the BSI = (2*3)/(5+7) = 0.5. This is then displayed as a percentage so it is 50%. It is a measure of how similar two lanes are and is best known as the “Dice” similarity.

Resources

Get in touch for a free trial