Host Cell Protein (HCP) Analysis Software | SpotMap

Click Here For Your Free Trial!

A Complete, Automated Software Solution for Host Cell Protein Antibody Coverage

Our SpotMap software first launched to market in 2015 and is the industry-leading host cell protein antibody coverage software in the pharmaceutical industry. SpotMap is unique and easy-to-use software, specifically designed to automate as much of the process of antibody validation as possible for use in high-throughput industrial applications.

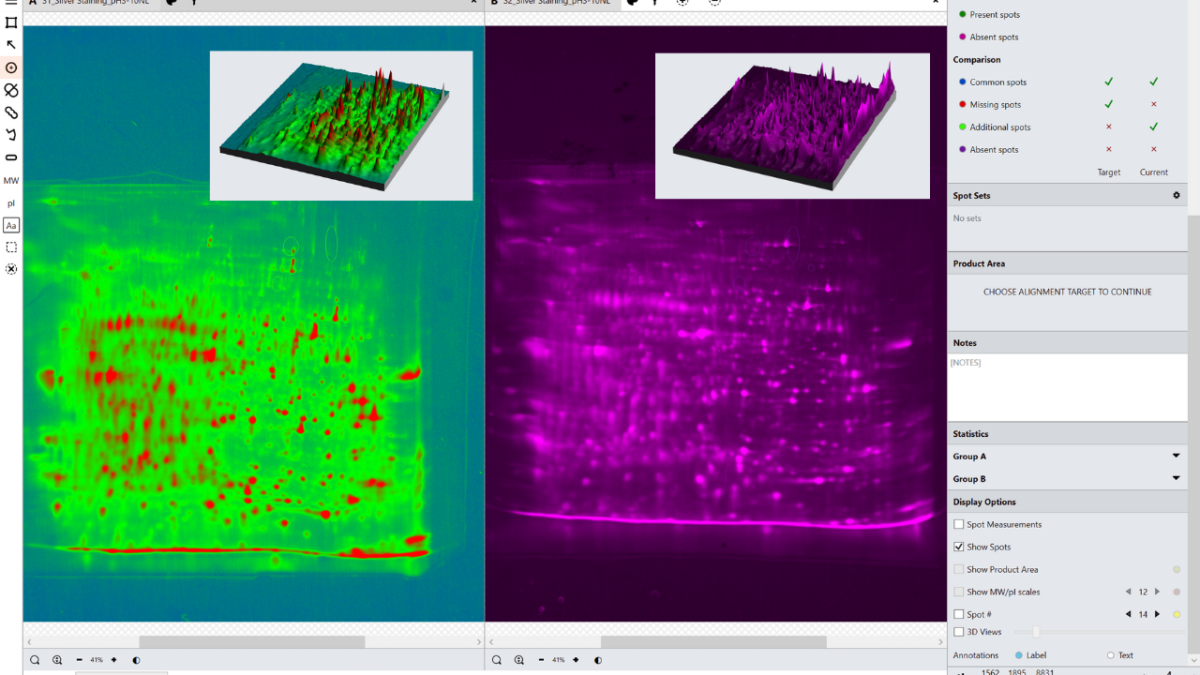
During biopharmaceutical development and manufacturing, host cell protein (HCP) impurities must be carefully identified and monitored to guarantee patient safety, drug efficacy and achieve FDA/EMA approval for your biotherapeutic. Two-dimensional gel electrophoresis (2D, 2-DE) and Western blotting remains the gold standard for anti-HCP coverage characterization, validating an anti-HCP antibody requires a polyclonal antibody mixture with broad reactivity against the diverse HCPs that may emerge during the production process. To do this, SpotMap allows you to automatically align and compare images of a 2D gel or blot of proteins detected with an anti-HCP antibody against an image revealing all potential HCP antigen proteins and calculating the antibody coverage percentage between the two.

SpotMap provides the complete solution for analyzing HCP antibody coverage when using 2D gel electrophoresis and Western blot images:

  • Universal. Supports all industry-standard image formats, including TIFF, GEL, MEL and IMG files. It also supports single stain, DIGE and DIBE techniques.
  • Speed. Get your anti-HCP antibody coverage % score in less than 10 minutes.
  • Objectivity. Unmatched automation reduces the need for manual intervention and minimizes into-operator variability.
  • Reproducible. Proven third-party evidence of consistent coverage results between different users and labs, drastically reducing subjectivity in your analysis.
  • Quantitation. Enables reliable, accurate quantitation of gel and blot images, allowing raw measurements of individual protein spots that can be exported.
  • Reportable. User configurable reports allow you to export your analysis results and your raw images into .PDF format.
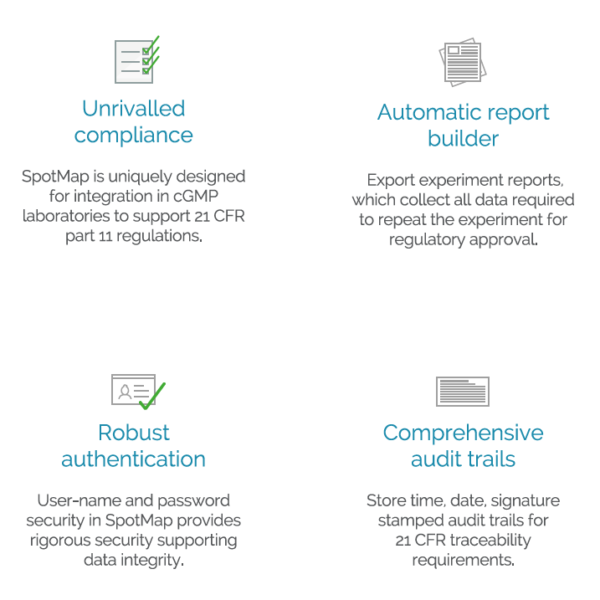
  • 21 CFR or GMP-compliance. When combined with our AuditSafe software, allows users to meet and even exceed FDA 21 CFR part 11/EudraLex Annex 11/GAMP5 standards for compliance within regulated or QC environments, from captured image all the way through to final analysis and report production. SpotMap is the only 2D HCP analysis software that is available in a 21 CFR/GxP compliant version.

The software has been developed in collaboration with and in response to pharmaceutical industry feedback, it is easy to master, with accurate results obtained quickly and reproducibly.

Our SpotMap software is trusted by the world’s leading pharmaceutical/CDMO companies

pharmaceutical companies

SpotMap HCP Analysis Software Demo

SpotMap free trial

“SpotMap helps support our internal and external client HCP projects, generating coverage data to inform both antibody and ELISA kit development. We love how intuitive the software is to use and how much easier and quicker it is to generate data compared to other software packages on the market. The decreased analysis time really aids our efficiency when we have dozens of blots to analyze for client projects and cuts down the time burden analysis can entail. Manual spot-editing features, such as the ability to quickly separate merged spots in a highly customizable manner with a single click, contribute to this decreased analysis time and enable us to increase our workflow.”

Head of Analytical Group, East Coast USA Biotech

Why do I need to know my HCP antibody coverage?

SpotMap is designed to help users analyze anti-HCP coverage – the percentage of immunodetection that an antibody reagent covers for the total population of HCPs within a sample. It does this by comparing a 2D gel or blot image of proteins detected with an anti-HCP antibody (your secondary image) against an image stained to reveal all possible HCP antigen proteins (your primary image).

HCP coverage analysis is used for:

  • Development of analytical methods (choice and validation of immunoassay reagents)
  • Selection and validation of the most appropriate generic HCP ELISA kit
  • Bridging studies to support assay replacement (e.g. change from commercial assay to platform assay or process-specific assay)
  • Generic assay re-validation for every new batch of reagent
  • Process- and platform-specific assay revalidation after changes that could affect HCP composition
  • Optimization of bioprocesses

The U.S., European and Japanese Pharmacopoeia all specify the use of 2-D gel electrophoresis followed by Western blot analysis (2-D Western blotting) as the gold standard for orthogonal anti-HCP antibody characterisation to evaluate anti-HCP antibody coverage:

host cell protein coverage %
2D Western Blot host cell protein coverage
host cell protein antibody coverage
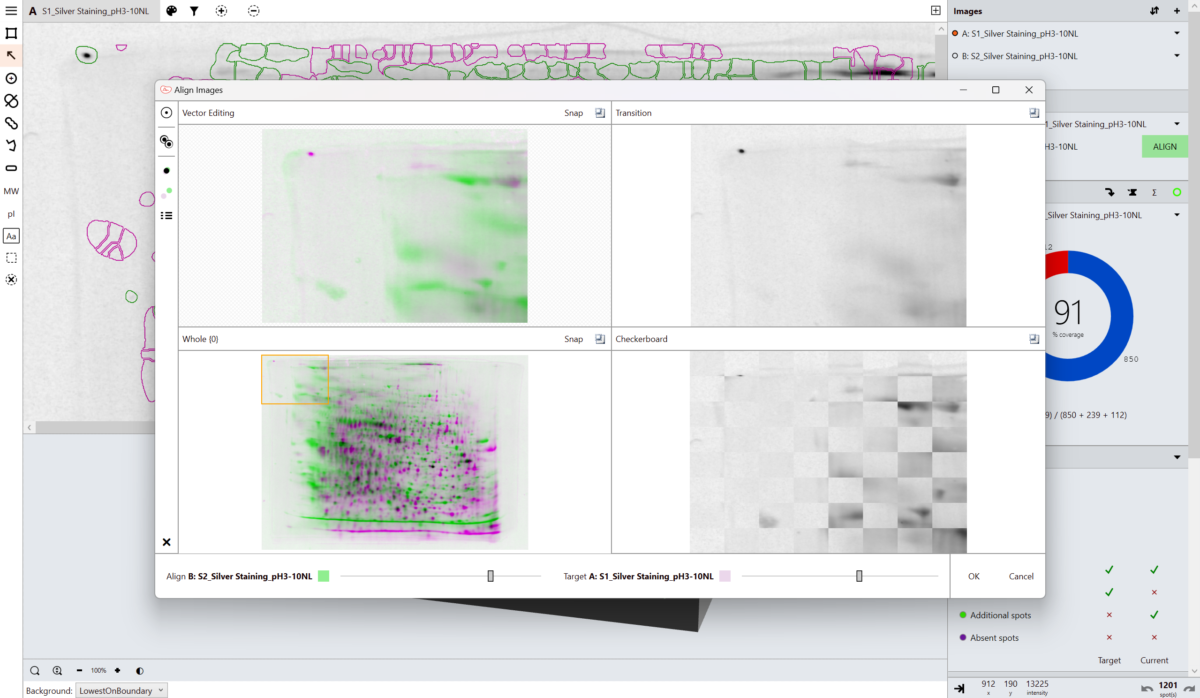
Automatic alignment of 2D Gel and Western Blot
host cell protein antibody coverage analysis

"SpotMap played an integral role in our comparison of proteomes of different cell lines during the process of choosing a proper antigen for antibody development. The ability to overlay gels and assign numbers to each protein spot was especially useful in determining similarities and differences between gels without duplicating identified spots. One feature that I found to be especially useful was the 3D view which allowed for a better visual of spot intensity when determining spots. The table of identified spot for each image also made it easy to identify which spots are unique or common to the different images. With this software, my team was able to make a more informed choice on the best candidate to use for our purposes."

Virginia Liu-Compton
- Senior Scientist II, ImmunoGen Inc, Waltham, Massachusetts, USA

Automatic and Manual Spot Detection and Editing

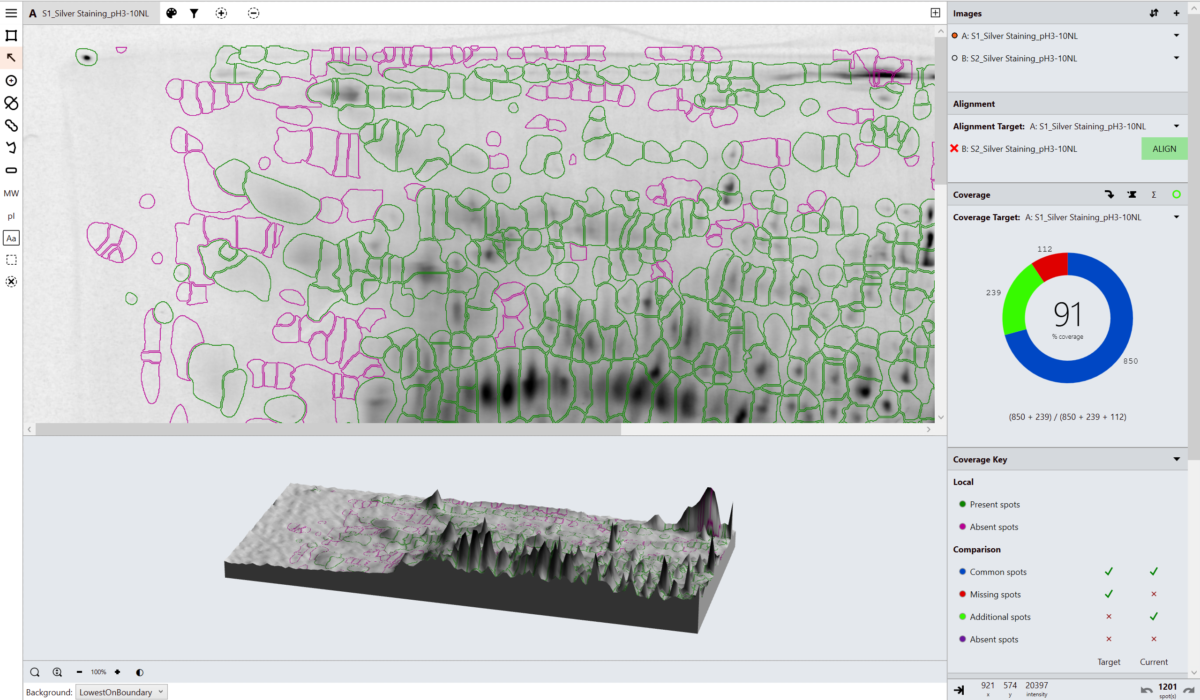
SpotMap employs industry leading advanced imaging techniques to automatically detect all of the spots within your selected image, with user configurable parameters of smoothing and spot peak sensitivity. This advanced algorithm can automatically detect all proteins, including those present only on the anti-HCP antibody image(s).

A rectangular or elliptical region of interest can be added to the analysis to target the spot detection to specific areas of the gel or blot image, however, sometimes the automatic spot detection results need to be refined in cases of poor quality images or experimental runs.

In cases such as this, SpotMap has integrated manual tools, refined by our close collaborations within the biopharmaceutical industry to make sure your analysis is as accurate as possible:

Optimize your host cell protein analysis workflow

We use intuitive, automated algorithms and an easy-to-use interface to enable users to obtain an accurate coverage percentage in around 10 minutes.

This enables users to achieve extremely reproducible antibody-to-host cell protein coverage, even between different users and labs. It provides reliable, accurate quantitation of gel and blot images so that you can achieve objective results.

Users are also able to verify host cell protein antibody reactivity, giving you a more complete understanding of the antigen quality.

If you’re looking for software to support HCP coverage analysis, make bioprocess improvements or achieve analytical development then request a free demo of SpotMap. You’ll receive guidance on how to achieve reproducible results, tips for aligning challenging gels and Western blots and knowledge on the software tools to use on more challenging images, such as faint spots.


We have had real difficulty matching reactions on blots to the corresponding areas on the gels. With our previous technology it genuinely wasn’t possible so adding the SpotMap software to our facility has helped greatly. […] Once we had the images put through SpotMap software it corresponded to areas that personally I would have never matched, which ended up being the correct areas.

Craig Pattinson
- Research Technician, Proteomics Aberdeen University

Every Quadrant Counts

SpotMap allows users to automatically divide their 2D gels or blots into quadrants, to further break down anti-HCP antibody coverage % into areas of low pI low MW, low pI high MW, High pI low MW and High pI High MW. This is especially useful for bridging assays between different lots of anti-HCP antibodies in the generation of process-specific ELISAs to ensure that both antibodies have a similar specificity across the range of host cell proteins, not just the same coverage based on spot number.

Quadrants are part of the innovate “spot sets” feature that allows users to customize their own unique groups of spots for easier analysis on their own (get a coverage score for a sub-population of spots for example) or they can choose one of the automatically created groups based on their current spots:

  • Quadrants
  • High/Low spots
  • Left/Right spots comparison
  • Overlapping spots
  • Top 100, 50, 10 spots based on either volume or area

Amongst many others. Using spot sets makes working with (and reporting coverage scores) on even large numbers of 2D spots much easier and quicker.

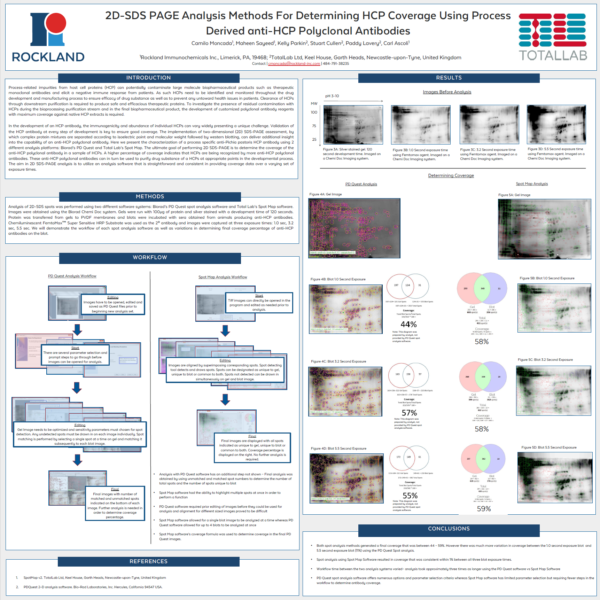
"Both spot analysis software generated a final coverage that was between 44 – 59%. However there was much more variation in coverage using BioRad's PDQuest than using SpotMap. Workflow between the two analysis systems varied by about 2 hours – analysis took approximately 1 hour using the SpotMap software and approximately 3.5 hours using the PDQuest software"

Camilo Moncada
- Rockland Immunochemicals

Identify and exclude Antibody Cross-reactivity from your Host Cell Protein Coverage %

In some cases your anti-HCP antibody can have non-specific binding with your drug substance or other product within your sample, leading to an artificially inflated coverage score as these spots are included within the reported coverage % but are not actually detected host cell proteins.

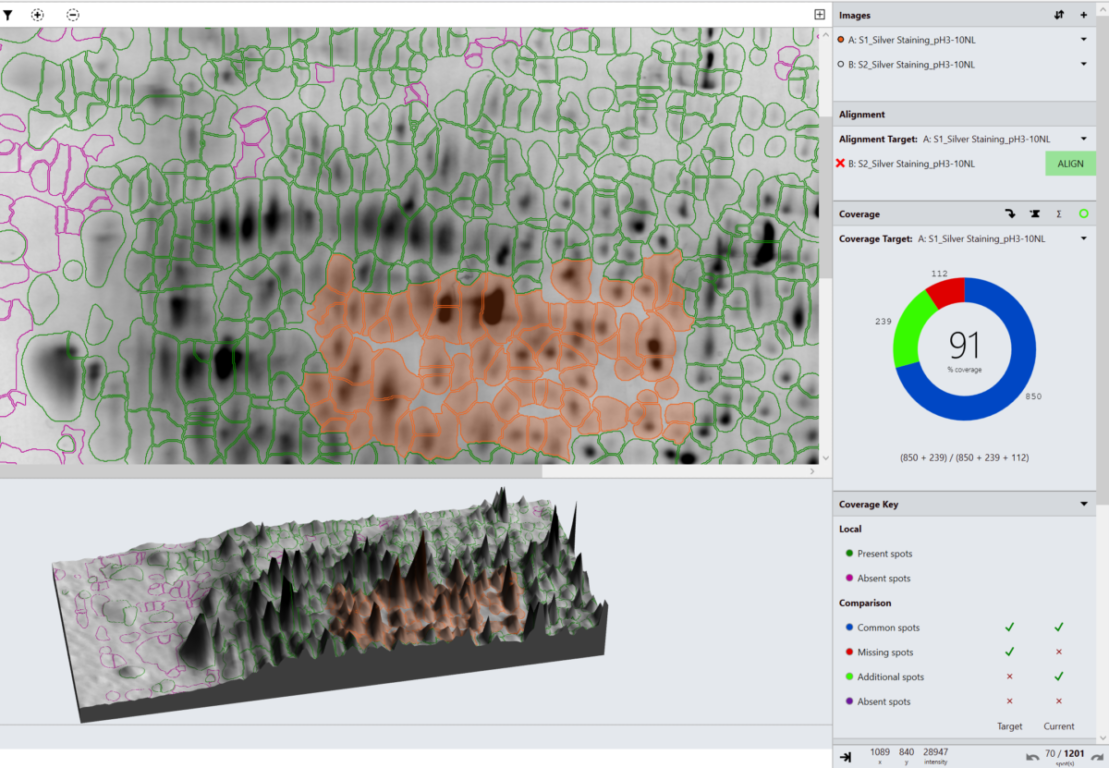
If you know your therapeutic drug substance exhibits some cross-reactivity with your anti-HCP antibody, SpotMap allows you to detect those spots and treat them separately to the “true” HCP positive spots using its innovative Product Spots function.

Simply mask the area on the blot image where your drug substance spots appear (based off either experience from previous runs or from the pI and MW ladder information present in the image) and SpotMap will allow you to create a new group of spots from those product spots. You can now toggle their inclusion using the standard spot sets controls to see how their inclusion would have inflated your overall anti-HCP coverage % score. SpotMap allows you to simultaneously increase accuracy in analysis whilst accounting for antibody cross-reactivity.


HCP cross reactivity

Report with confidence

  • Automatically generate a comprehensive report of your entire analysis, including original images, summarizing all essential quality control checks, analysis parameters, results, images, tables and coverage charts in a single document. A detailed spot measurements table can also be appended to your report
  • Easily visualize and export critical analysis parameters such as position of alignment vectors and spots that were excluded or edited
  • Save, print or copy to clipboard all project data, tables and images (2D and 3D views, graphical reports, Display area, Application window)
  • Carry out pI/MW calibration to help interpretation of mass spectroscopy-based identification data

FDA 21 CFR part 11 regulations stipulate the need to track, record and authenticate your experiments. With our TotalLab GxP Module, you’re able to control system access, record user activity and define project sign-off procedures to ensure compliance with FDA regulations. You can read more about it here.

Case Studies (Click to Enlarge)

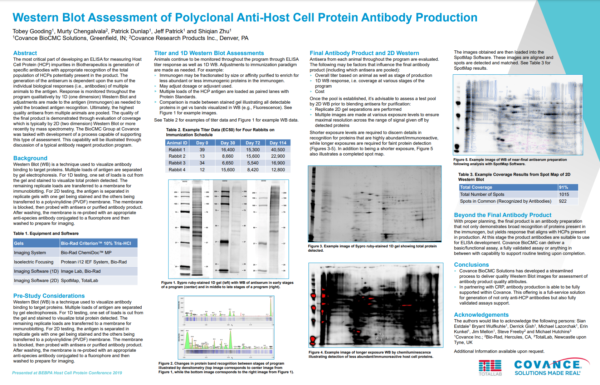
Case Study: Western Blot Assessment of Polyclonal Anti-Host Cell Protein Antibody Production, Covance BioCMC (Now LabCorp)

LabCorp anti-host cell protein antibody using SpotMap

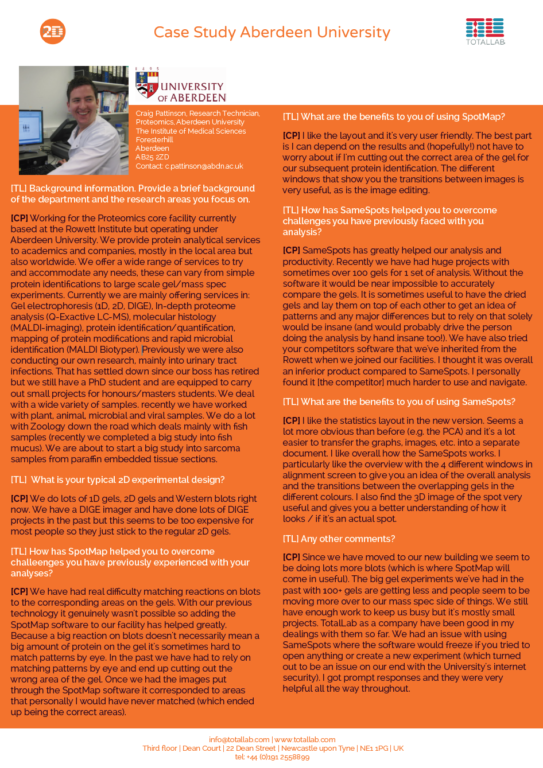
Case Study: University of Aberdeen, Proteomics Core facility

“The proteomics core facility provide protein analytical services to academics and companies, mostly in the local area but also worldwide. We offer a wide range of services to try and accommodate any needs, these can vary from simple protein identifications to large scale gel/mass spec experiments. Currently we are mainly offering services in: Gel electrophoresis (1D, 2D, DIGE), In-depth proteome analysis (Q-Exactive LC-MS), molecular histology (MALDI- imaging), protein identification/quantification, mapping of protein modifications and rapid microbial identification (MALDI Biotyper).”

“We have had real diffculty matching reactions on blots to the corresponding areas on the gels. With our previous technology it genuinely wasn’t possible so adding the SpotMap software to our facility has helped greatly. Because a big reaction on blots doesn’t necessarily mean a big amount of protein on the gel it’s sometimes hard to match patterns by eye. In the past we have had to rely on matching patterns by eye and end up cutting out the wrong area of the gel. Once we had the images put through the SpotMap software it corresponded to areas that personally I would have never matched (which ended up being the correct areas).”

Craig Pattinson, Research Technician, Proteomics, Aberdeen University

Case Study: Rockland Immunochemicals SpotMap vs PDQuest for 2D-SDS PAGE Analysis For Determining HCP Coverage

Poster, originally presented at the WCBP 2016 conference: “2D-SDS PAGE Analysis Methods For Determining HCP Coverage Using Process Derived anti-HCP Polyclonal Antibodies”

Rockland 2D-SDS PAGE anti-HCP polyclonal antibodies poster

“Both spot analysis methods generated a final coverage that was between 44 – 59%. However there was much more variation in coverage between the 1.0 second exposure and 5.5 second exposure (11%) using the PDQuest Spot analysis. Spot analysis using SpotMap resulted in coverage that was consistent within 1% between all three blot exposure times. Workflow between the two analysis systems varied by about 2 hours – analysis took approximately 1 hour using the SpotMap software and approximately 3.5 hours using the PDQuest software. PDQuest spot analysis software offers numerous options and parameter selection criteria whereas SpotMap software has limited parameter selection but requiring fewer steps in the workflow to determine antibody coverage.”

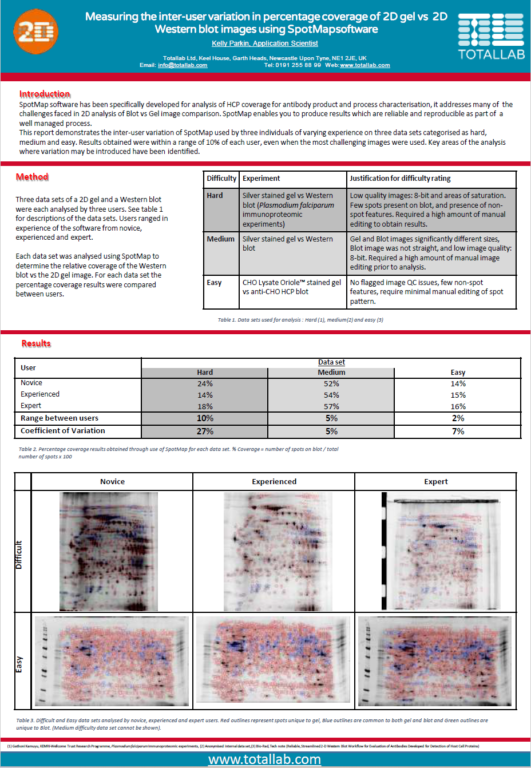
Case Study: Minimising Inter-User Variation in Coverage of 2D Gels

This report demonstrates the inter-user variation of SpotMap used by three individuals of varying experience on three data sets categorized as hard, medium and easy. Results obtained were within a range of 10% of each user, even when the most challenging images were used. Key areas of the analysis where variation may be introduced have been identified.

“Typically with 2D gels and Western blots the biggest source of variation is the image quality. The automatic image QC flagged two of the data analysis results as being potentially imprecise due to the use of 8-bit images. Smearing/steaking, saturation and presence of non-spot features also affects analysis precision.

There are areas of the analysis that require particular consideration to improve objectivity and precision. Within the software, image editing, alignment vectors added, spot detection parameters used and individual decisions on the presence of a spot will all impact the results.

However, SpotMap gives reproducible and reliable results within a range of 10%, even using challenging images. The use of high quality images which enable a consistent analysis approach between users will reduce the variation, as seen in the easy data set where results are within a range of 2%. Production of an SOP that addresses all aspects of the analysis, including optimized gel running and image capture would increase the objectivity of the results, reducing the subjective decisions required during analysis.”

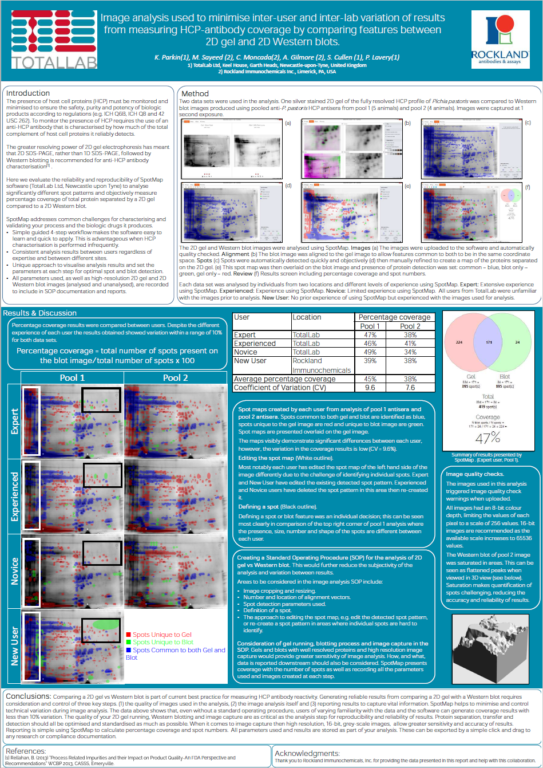
Case Study: Image analysis used to minimize inter-user and inter-lab variation of results from measuring HCP-antibody coverage

Poster, originally presented at the WCBP 2018 conference: “Image analysis used to minimize inter-user and inter-lab variation of results from measuring HCP-antibody coverage by comparing features between 2D gel and 2D Western blots.”

How to Purchase

The best way to ensure you’re purchasing the latest version of SpotMap with the highest level of technical support is directly from us here at TotalLab by using the contact us form. We can accept payment in GBP (£), USD ($) or EUR (€).

We do appreciate that some of our customers prefer sourcing products locally in a local currency or prefer to deal in their native language which may not be English. To facilitate this, TotalLab work with a global network of authorized distributors which you can find here.

References

Our SpotMap software has been in active development since 2011 and in that time has been cited numerous times in proteomics and anti-HCP antibody generation best practice guides within the field:

proteomic profiling methods and protocolsheterologous protein production in CHO cells

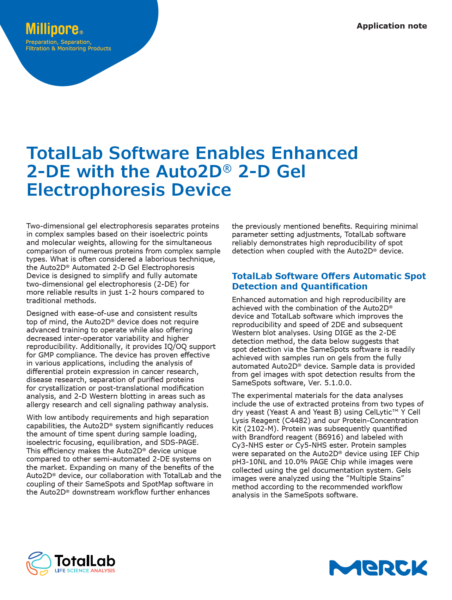
We also collaborate with global equipment manufacturers to optimize the use of their equipment with our software, such as Merck’s Auto2D device for automated 2D gel running and imaging:

TotalLab software Merck Auto2D 2-D Gel Electrophoresis

Academic References


FAQs

Can I check my image quality?

Yes.


Images are quality checked and any issues/notes are available to view.

Can I edit my images?

Yes.


Quick edits are available below each image to invert the color intensities and flip or crop the images. More edits can be performed in the image editor window, accessed by right clicking on the image and selecting “Edit” from the menu. It is recommended that image edits are performed within the software as this will not affect the raw data of the images.

What problems does image editing solve?

Images which are different in size, shape and orientation are hard to compare directly. Poor image quality can make analysis of your 2D gels and Western blots difficult and reduce the objectivity of your results.

What edit options are available?

• Flip images horizontally and vertically

• Rotate images 90 degrees clockwise and anti-clockwise

• Invert image

• Translate image

• Crop image

• Rotate image a variable angle

• Resize images to same size

Can I account for gel/blot distortions?

Yes.


Our unique, next-generation pixel level alignment algorithm makes it possible to accurately compare images by removing the positional variation introduced during the electrophoresis and imaging process. Making sure you only detect true changes in protein expression within your sample rather than from experimental or imaging variability.

Can I identify spots of interest?

Yes.


You can add text labels on the image. These can also point towards certain features on the gel/blot that are of interest.

Can I measure percentage coverage of 2D gels and Western blots?

Yes.


Based upon the categorisation of spots, percentage coverage of one image vs another is calculated.

Can I compare spot measurements?

All spot measurements are available for export or may be viewed in the table within the software. Spot measurements include volume, peak height, area, background and position. If pI/MW information has been added to the image the estimated values are also available.

Can I calculate spot coverage?

Yes.


A spot map is created of the fully resolved host cell protein. The presence of spots expressed on the blot is then used to calculate the relative coverage of the Western blot vs the 2D gel.

Can I export results?

Yes.


A spot map is created of the fully resolved host cell protein. The presence of spots expressed on the blot is then used to calculate the relative coverage of the Western blot vs the 2D gel.

What is Image QC?

When adding images to the project they are quality checked and any issues/notes are highlighted for you immediately before any further analysis is attempted.
Image QC flags any potential issues with:


• Bit-depth

• Image file size

• Saturation

• Manual editing of the images


Poor image quality can make analysis of your gels and blots difficult and may reduce the objectivity of your analysis.

What are the benefits of using high quality images?

Quantification of spot intensities may seem less important when only looking at spot numbers and coverage results. However, good quality images also improve:


• Spot Detection

• Filtering options when selecting small/low spots to remove

• Definition of spots on the blot (no saturation)

• Automatic alignment algorithm

What does the analysis mode do?

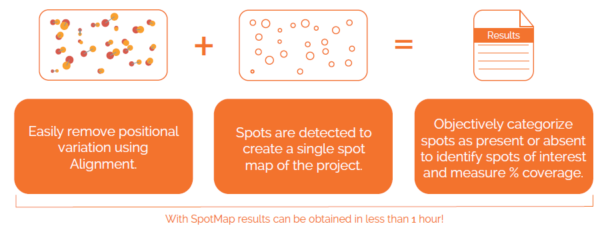
In the analysis mode, a master spot map identifying the location of all spots in the project is created and spots on each image are categorized as present or absent from this map. The present or absent settings are used to identify spots common, missing or additional to the images in a comparison and measure % coverage.

Why is a single spot map used for the analysis?

Alignment places corresponding spots in the same coordinate space on the images, this allows a single spot map to be used. Using a single spot map allows you to directly compare matching spots/features between images and easily identify spots absent from that given image.

What is spot coverage and how is this calculated?

Spot coverage is the percentage of spots in the comparison being made which are present on the secondary image. Percentage coverage is calculated against the chosen base image using the calculation:

Percentage coverage = (Common + Additional)/(Common + Missing + Additional) x 100

What is a base image?

The base image is the image against which the others are compared. The base image can be selected to be any other image in the analysis. The term secondary image refer to any image compared to the base image.

What does automatic spot detection do?

Using advanced imaging techniques an initial spot map is created of the selected image within the set parameters of smoothing and peak sensitivity. A rectangular or elliptical region of interest can be added to the analysis to target the spot detection.

Why are spots copied from the gel to the blot and not separately detected on the blot?

Western blots are often fuzzier than stained gels with spots that have bloomed due to the way antibodies are detected on the blot. Algorithms designed to detect spots on gels often fail on blots due to this difference. We therefore detect on the cleaner gel and copy the spot shapes over to the blot after alignment. This really helps the user see where the spots exist on the blot.

Why are spots detected on only one image?

Only one spot pattern needs to be detected as corresponding spots are in the same coordinate space on all images following alignment. The chosen image should be the one with the most spots present or the most representative spot pattern.

Why are some spot edits required?

Sometimes the automatic spot detection results need to be refined. Spot outlines around the edge can be removed. Spot outlines in the middle can be added, deleted, merged or split. Additional spots can be added to the map. Our tests have shown that you can have different levels of editing (little or a lot) and still get similar coverage results. It is key to be consistent so that you get similar results across experiments. Using the spot assignment feature when editing spots will aid in categorizing spots by pre setting the presence or absence of a spot on all other images.

Why select spots using filters?

The filter option is usually used to objectively select spots you may wish to remove from the spot map or categorize as present or absent from the image. A filter clause can be created based upon a measurement of area, volume or peak height and set based on a specific value, a selected spot or chosen from a sliding scale. Selected spots can also be used to create a spot set.

What is a spot set?

A spot set can be created from a spot selection, manually chosen spots or predefined areas, i.e. quadrants. Results and spot measurements can be collated for each spot set.

Can I add molecular weight and pH markers?

Yes.


Markers can be added to the map to identify the MW markers. A linear or non-linear pI strip can be added to the map.

How does identifying spots as present or absent allow results to be calculated?

The present or absent categorizations from the spot map allow comparisons of images to be made. When any two images (the base and the secondary) are compared the spot presence/absence settings are used to determine which spots are Common, Missing or Additional and are used to calculate percentage coverage.


Resources

Image Capture Guide for Gel Electrophoresis Images

Good image capture is critical to guarantee optimal performance of automated image analysis packages and generate reliable scientific data. This technical document provides a brief guide to the range of different image acquisition devices currently in use for gel applications, defines some the important technical factors required to generate digital images of a quality suitable for automated image analysis and recommendations for producing good 2D gel images.

Read More >

What is Host Cell Protein?

Discover what host cell proteins (HCPs) are, why they matter in biologic drug development, and how they’re analyzed for safety. Learn about common HCP analysis methods, challenges, and strategies to manage risks, with insights on tools from Totallab.

Read More >

The Essential Guide to 2D Gel Electrophoresis

Learn how 2D gel electrophoresis can separate proteins by isoelectric point and molecular weight, aiding in analysis and research. Perfect for understanding complex protein mixtures and identifying biomarkers.

Read More >

2D DIGE Western Blot vs Standard 2D vs ELISA vs AAE

Explore the current landscape of anti-HCP antibody coverage with our article comparing 2D DIGE, ELISA, and AAE. Optimise your antibody selection process for robust anti-HCP analysis in biopharmaceutical research.

Read Document >

2D-SDS PAGE Analysis Methods For Determining HCP Coverage Using Process Derived anti-HCP Polyclonal Antibodies

Here we present the characterization of a process specific anti-Pichia pastoris HCP antibody using 2 different analysis platforms: Biorad’s PDQuest and TotalLab’s SpotMap.

Read Document >

Examples and Evidence

We work closely with our customers from across the globe to ensure they get the best from SpotMap. Please find here a collection of examples and evidence of SpotMap being used by various Industrial and Academic customers and presented at conferences worldwide.

Read More >