Can I check my image quality?
Yes.
Images are quality checked and any issues/notes are available to view.
Can I edit my images?
Yes.
Quick edits are available below each image to invert the color intensities and flip or crop the images. More edits can be performed in the image editor window, accessed by right clicking on the image and selecting “Edit” from the menu. It is recommended that image edits are performed within the software as this will not affect the raw data of the images.
What problems does image editing solve?
Images which are different in size, shape and orientation are hard to compare directly. Poor image quality can make analysis of your 2D gels and Western blots difficult and reduce the objectivity of your results.
What edit options are available?
• Flip images horizontally and vertically
• Rotate images 90 degrees clockwise and anti-clockwise
• Invert image
• Translate image
• Crop image
• Rotate image a variable angle
• Resize images to same size
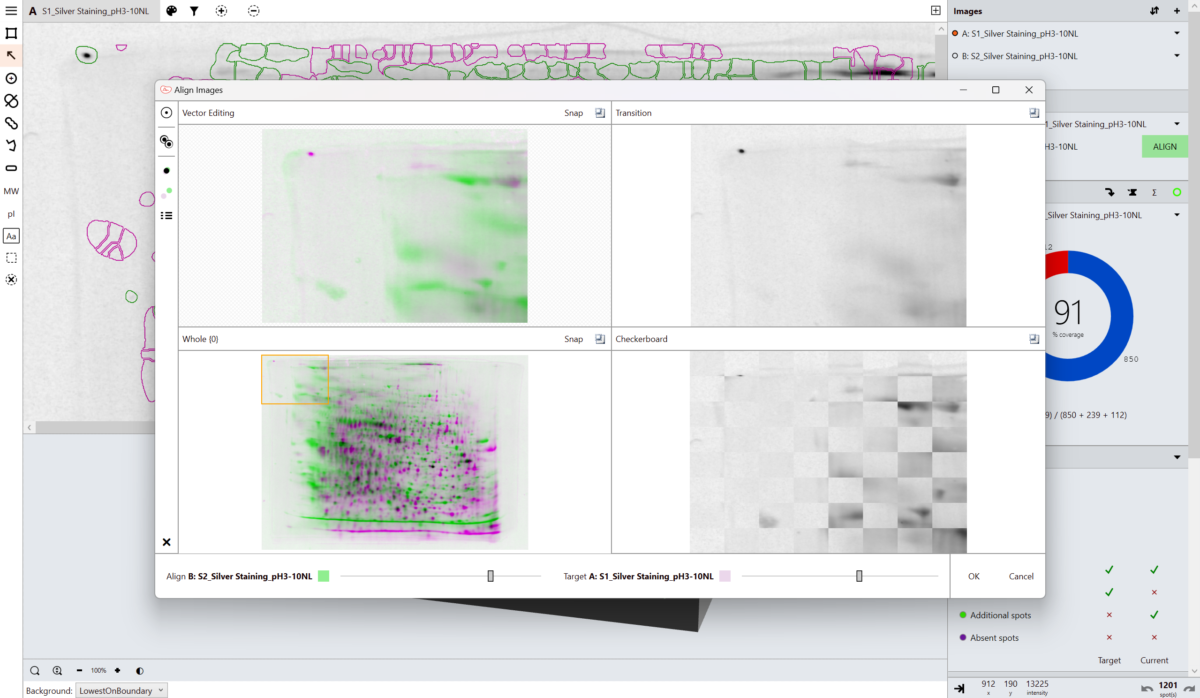
Can I account for gel/blot distortions?
Yes.
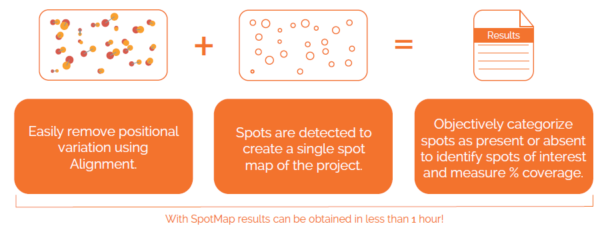
Our unique, next-generation pixel level alignment algorithm makes it possible to accurately compare images by removing the positional variation introduced during the electrophoresis and imaging process. Making sure you only detect true changes in protein expression within your sample rather than from experimental or imaging variability.
Can I identify spots of interest?
Yes.
You can add text labels on the image. These can also point towards certain features on the gel/blot that are of interest.
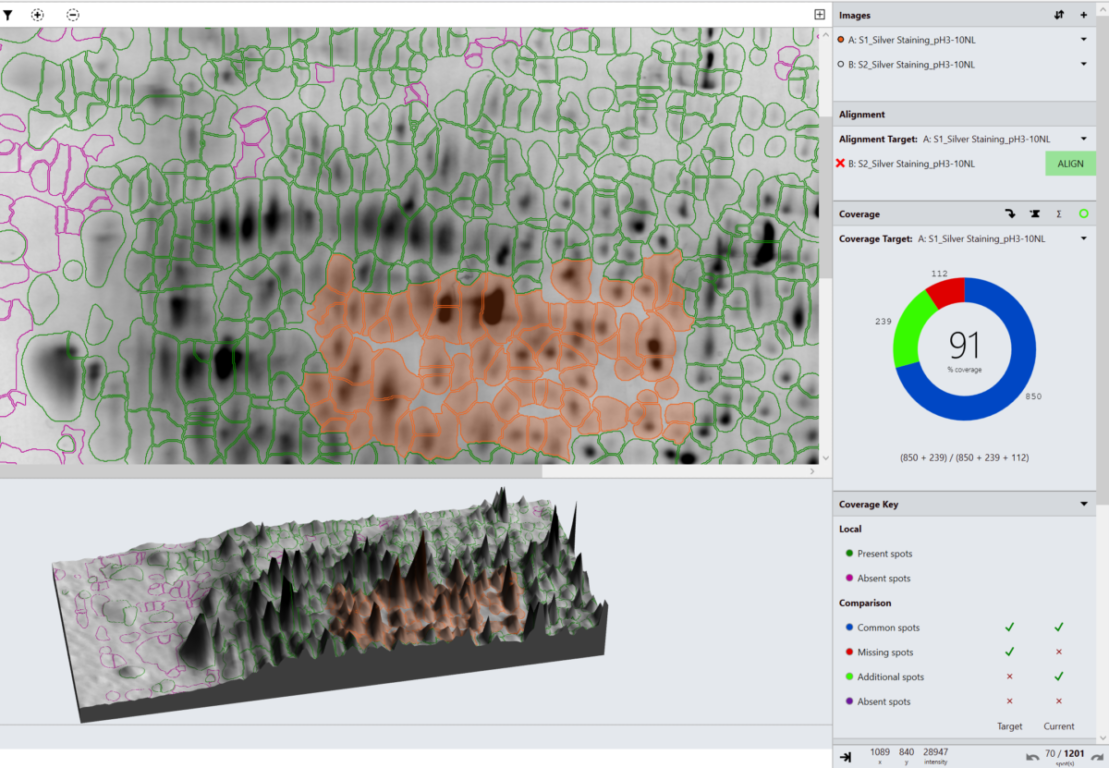
Can I measure percentage coverage of 2D gels and Western blots?
Yes.
Based upon the categorisation of spots, percentage coverage of one image vs another is calculated.
Can I compare spot measurements?
All spot measurements are available for export or may be viewed in the table within the software. Spot measurements include volume, peak height, area, background and position. If pI/MW information has been added to the image the estimated values are also available.
Can I calculate spot coverage?
Yes.
A spot map is created of the fully resolved host cell protein. The presence of spots expressed on the blot is then used to calculate the relative coverage of the Western blot vs the 2D gel.
Can I export results?
Yes.
A spot map is created of the fully resolved host cell protein. The presence of spots expressed on the blot is then used to calculate the relative coverage of the Western blot vs the 2D gel.
What is Image QC?
When adding images to the project they are quality checked and any issues/notes are highlighted for you immediately before any further analysis is attempted.
Image QC flags any potential issues with:
• Bit-depth
• Image file size
• Saturation
• Manual editing of the images
Poor image quality can make analysis of your gels and blots difficult and may reduce the objectivity of your analysis.
What are the benefits of using high quality images?
Quantification of spot intensities may seem less important when only looking at spot numbers and coverage results. However, good quality images also improve:
• Spot Detection
• Filtering options when selecting small/low spots to remove
• Definition of spots on the blot (no saturation)
• Automatic alignment algorithm
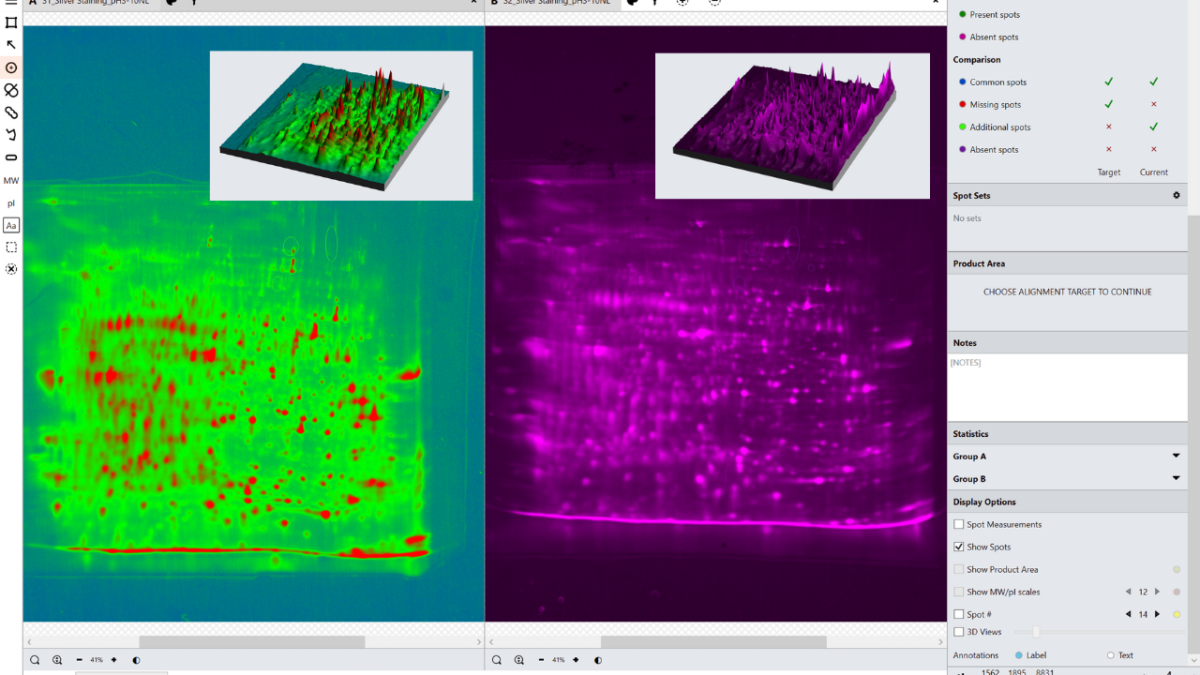
What does the analysis mode do?
In the analysis mode, a master spot map identifying the location of all spots in the project is created and spots on each image are categorized as present or absent from this map. The present or absent settings are used to identify spots common, missing or additional to the images in a comparison and measure % coverage.
Why is a single spot map used for the analysis?
Alignment places corresponding spots in the same coordinate space on the images, this allows a single spot map to be used. Using a single spot map allows you to directly compare matching spots/features between images and easily identify spots absent from that given image.
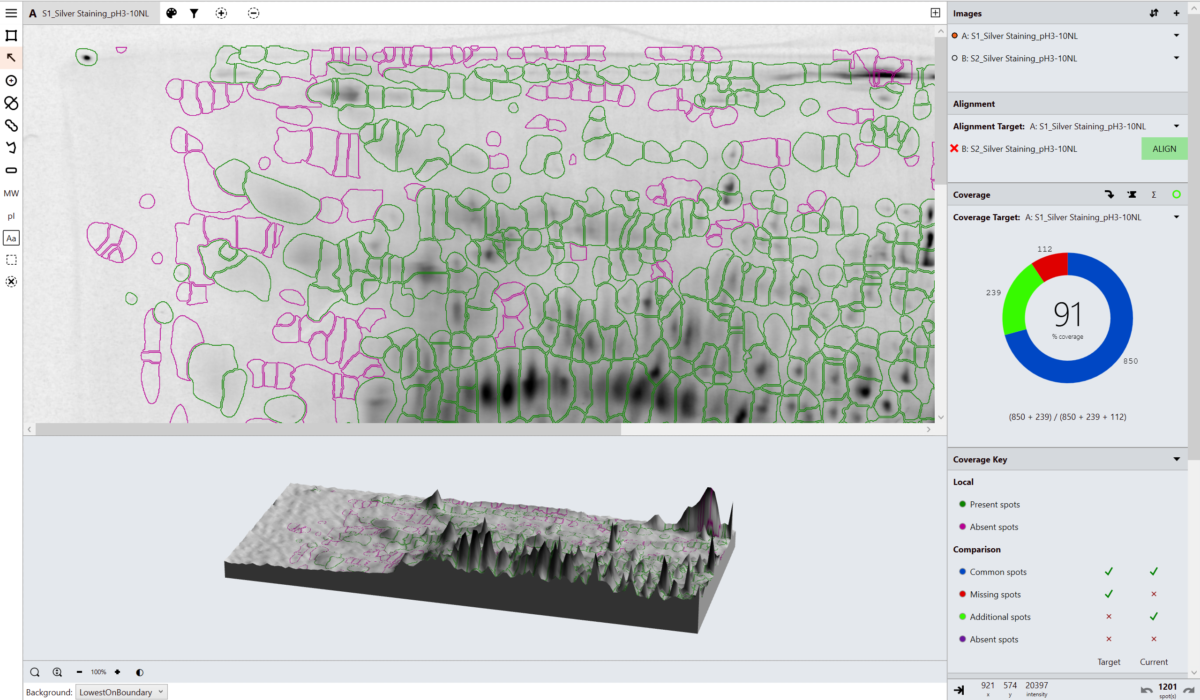
What is spot coverage and how is this calculated?
Spot coverage is the percentage of spots in the comparison being made which are present on the secondary image. Percentage coverage is calculated against the chosen base image using the calculation:
Percentage coverage = (Common + Additional)/(Common + Missing + Additional) x 100
What is a base image?
The base image is the image against which the others are compared. The base image can be selected to be any other image in the analysis. The term secondary image refer to any image compared to the base image.
What does automatic spot detection do?
Using advanced imaging techniques an initial spot map is created of the selected image within the set parameters of smoothing and peak sensitivity. A rectangular or elliptical region of interest can be added to the analysis to target the spot detection.
Why are spots copied from the gel to the blot and not separately detected on the blot?
Western blots are often fuzzier than stained gels with spots that have bloomed due to the way antibodies are detected on the blot. Algorithms designed to detect spots on gels often fail on blots due to this difference. We therefore detect on the cleaner gel and copy the spot shapes over to the blot after alignment. This really helps the user see where the spots exist on the blot.
Why are spots detected on only one image?
Only one spot pattern needs to be detected as corresponding spots are in the same coordinate space on all images following alignment. The chosen image should be the one with the most spots present or the most representative spot pattern.
Why are some spot edits required?
Sometimes the automatic spot detection results need to be refined. Spot outlines around the edge can be removed. Spot outlines in the middle can be added, deleted, merged or split. Additional spots can be added to the map. Our tests have shown that you can have different levels of editing (little or a lot) and still get similar coverage results. It is key to be consistent so that you get similar results across experiments. Using the spot assignment feature when editing spots will aid in categorizing spots by pre setting the presence or absence of a spot on all other images.
Why select spots using filters?
The filter option is usually used to objectively select spots you may wish to remove from the spot map or categorize as present or absent from the image. A filter clause can be created based upon a measurement of area, volume or peak height and set based on a specific value, a selected spot or chosen from a sliding scale. Selected spots can also be used to create a spot set.
What is a spot set?
A spot set can be created from a spot selection, manually chosen spots or predefined areas, i.e. quadrants. Results and spot measurements can be collated for each spot set.
Can I add molecular weight and pH markers?
Yes.
Markers can be added to the map to identify the MW markers. A linear or non-linear pI strip can be added to the map.
How does identifying spots as present or absent allow results to be calculated?
The present or absent categorizations from the spot map allow comparisons of images to be made. When any two images (the base and the secondary) are compared the spot presence/absence settings are used to determine which spots are Common, Missing or Additional and are used to calculate percentage coverage.