2D gel electrophoresis followed by Western blotting to determine host cell protein coverage is a powerful technique.
It can deliver additional discovery into the capability of an anti-HCP antibody. However, there are still additional challenges in your 2D Western blot analysis experiment…
The quality of spot detection greatly affects the percentage coverage results you obtain from your experiment. Spots with varying intensities must be accurately quantified in order to obtain meaningful results.
Protein spot quantification HCP coverage
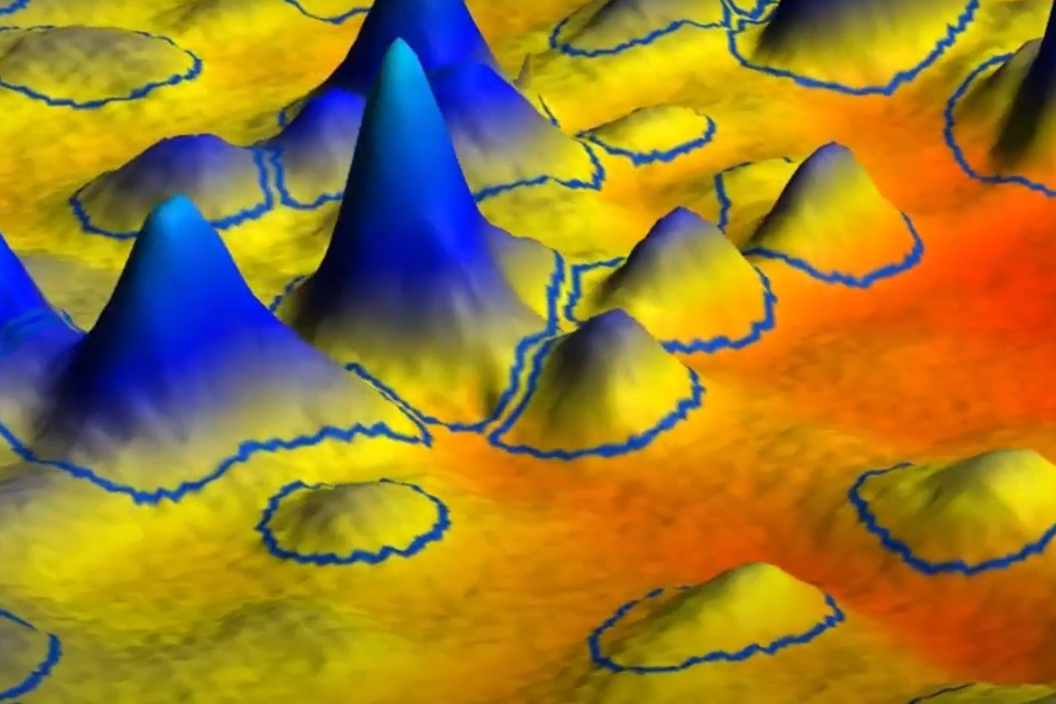
In this video we show you how automatic spot outlines in SpotMap obtain an objective, accurate and quantitative analysis and how you can use 3D mode to validate the software you currently use for HCP coverage.
Validate the quantitative value of spot detection
Try looking at the edges of the spots to see if the spot outlines reach the background.
- Do all or some of the spot outlines go to the background?
- If only some, or none reach the bottom of the spot in 3D mode this is a warning that the quantification of your experiment is reduced.
- Are the spot outlines well-defined in 3D mode?
- They should be clean and uniform to the edge, any inconsistencies in the shape means that the detection is not accurate making it impossible to accurately compare spots.
SpotMap is a complete solution for analysing HCP coverage with 2D gel electrophoresis and Western blot images.
Contact us for a demonstration of the software and its capabilities.


