How our CLIQS software supported the University of Liverpool with fast and reliable 1D gel analysis
The research emphasis of the University of Liverpool’s laboratory is the analysis of the effect of cell shape on calcium signalling and cell cycle progression in mammalian cells.
A number of different experimental approaches were employed to determine shape-dependent signalling events in cultured fibroblasts including cDNA array hybridisation, laser scanning confocal microscopy, flow cytometry and Western blotting.
The laboratory employed quantitative protein expression analysis by iTRAQ and validated results using Western blot.
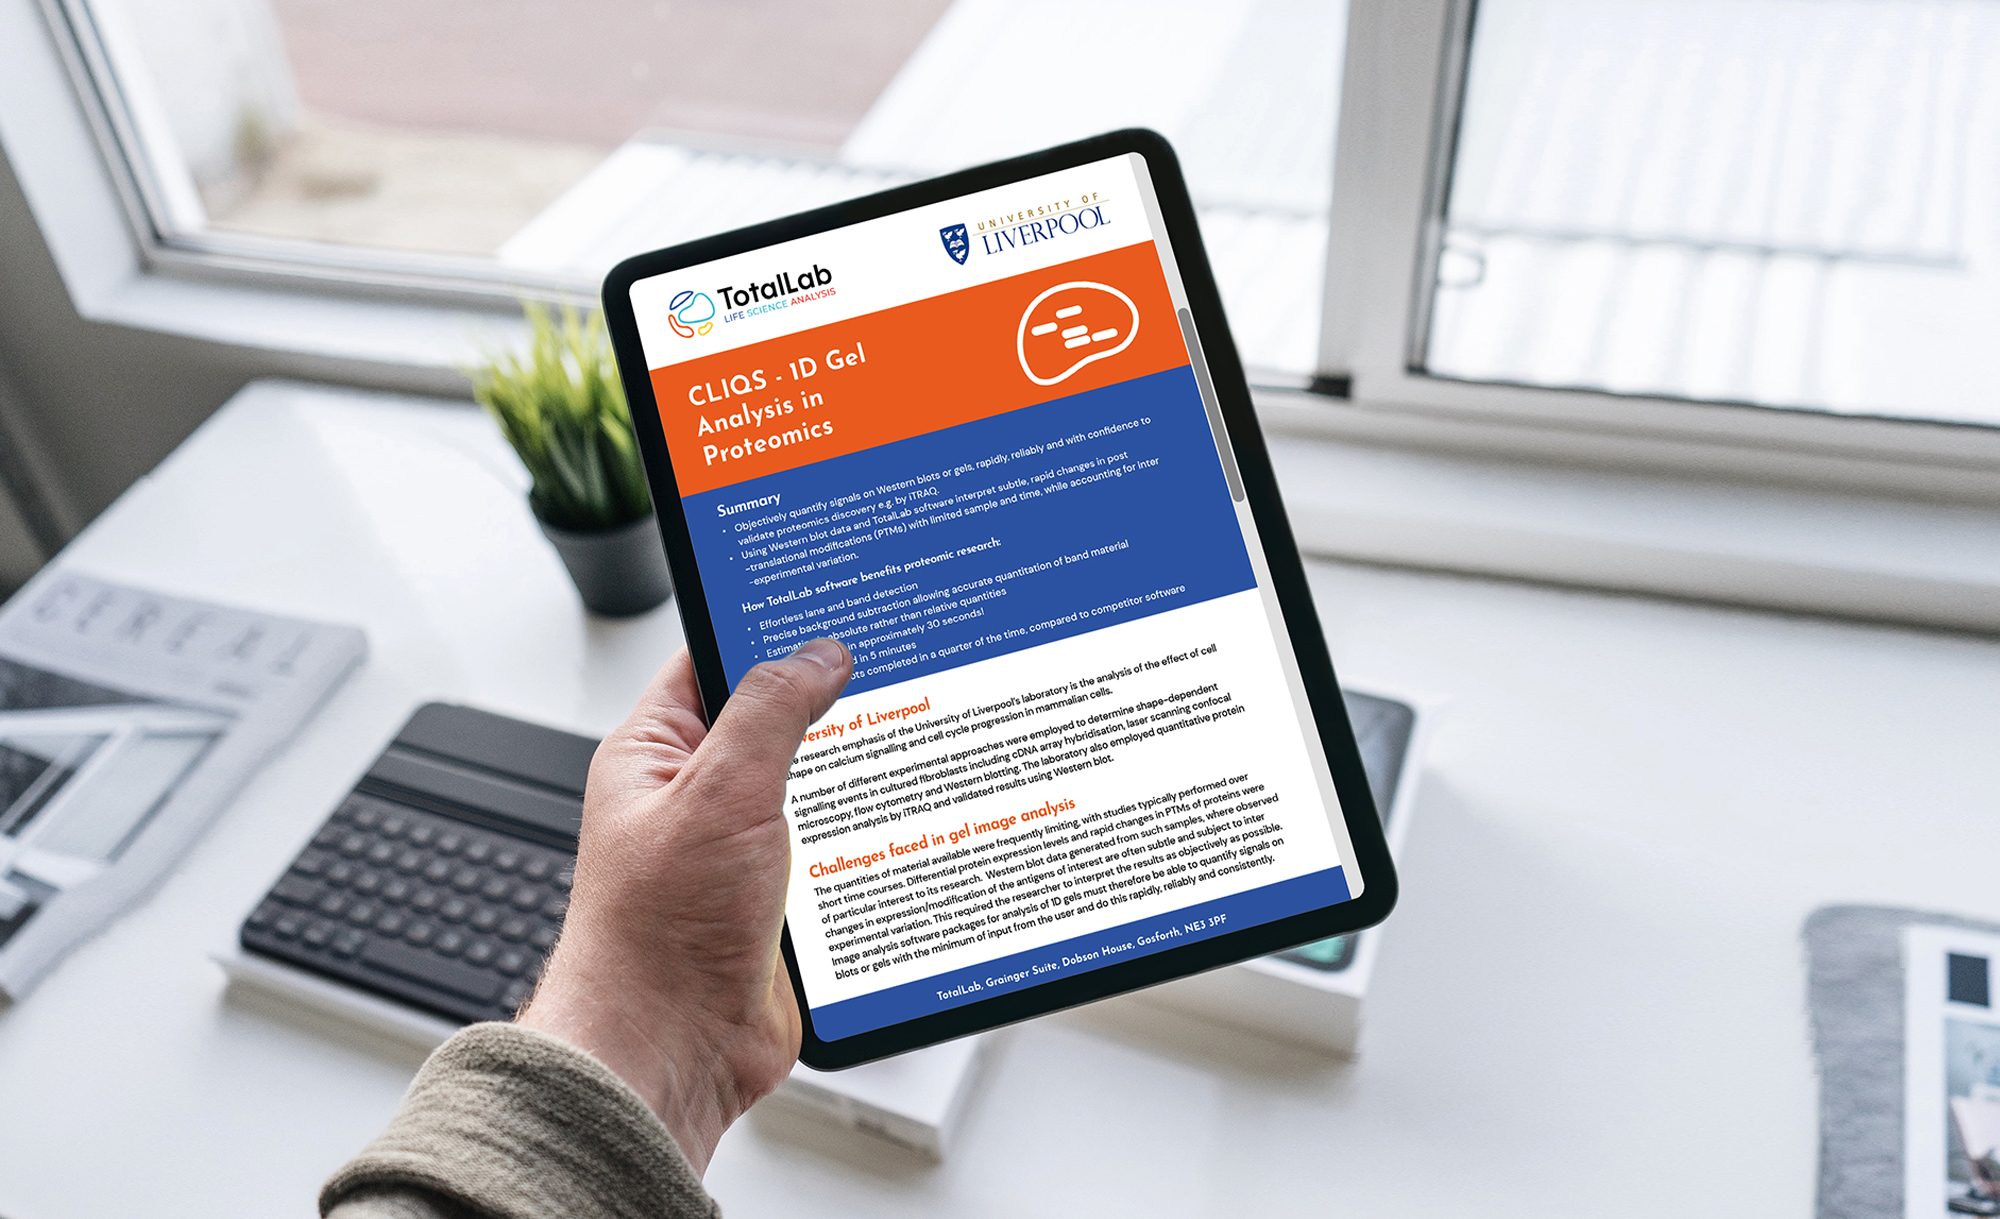
Read on to hear about how the research team compared CLIQS with an alternative package, you can also download a printable copy of the case study here.
The challenges faced in gel image analysis
The quantities of material available were frequently limiting, and studies were typically performed over short time courses.
Differential protein expression levels and rapid changes in post-translational modifications (PTMs) of proteins were of particular interest to the laboratory’s research.
Western blot data was generated from samples where observed changes in expression /modification of the antigens of interest are often subtle and subject to inter experimental variation. This therefore required the researcher to interpret the results as objectively as possible.
Image analysis software packages for analysis of 1D gels must therefore be able to quantify signals on blots or gels with the minimum of input from the user and do this rapidly, reliably and consistently.
How CLIQS software delivered rapid and reliable image analysis
A TIFF image of the blot is required so that files from various image acquisition devices may readily be analysed. Through a guided workflow, the software detected lanes and the background was subtracted automatically.
Using CLIQS it is not necessary to draw around the band of interest, to guess at which part of the blot best represents the background signal or to be overly concerned about smearing of bands. This is because there are options for determining the molecular weight of bands of interest from standards run on the gel and for normalising to a particular band to estimate absolute rather than relative quantities.
Using our software, the team at the University of Liverpool repeated the analysis of a set of 16 blots, that had previously been analysed using an alternative package. The analysis was completed in approximately a quarter of the time and, since there was little user influence on the band detection, there was a greater degree of confidence in the statistical significance of the resulting data.
The quantitative data was presented in a spreadsheet that could be exported to Excel for manipulation and analysis.
Applying intuitive algorithms to support complex image analysis
Imperfect or complex images can be difficult for any software to handle. However, the semi-automated process of lane and band detection, as well as background subtraction, requires little more input than the fully automated process.
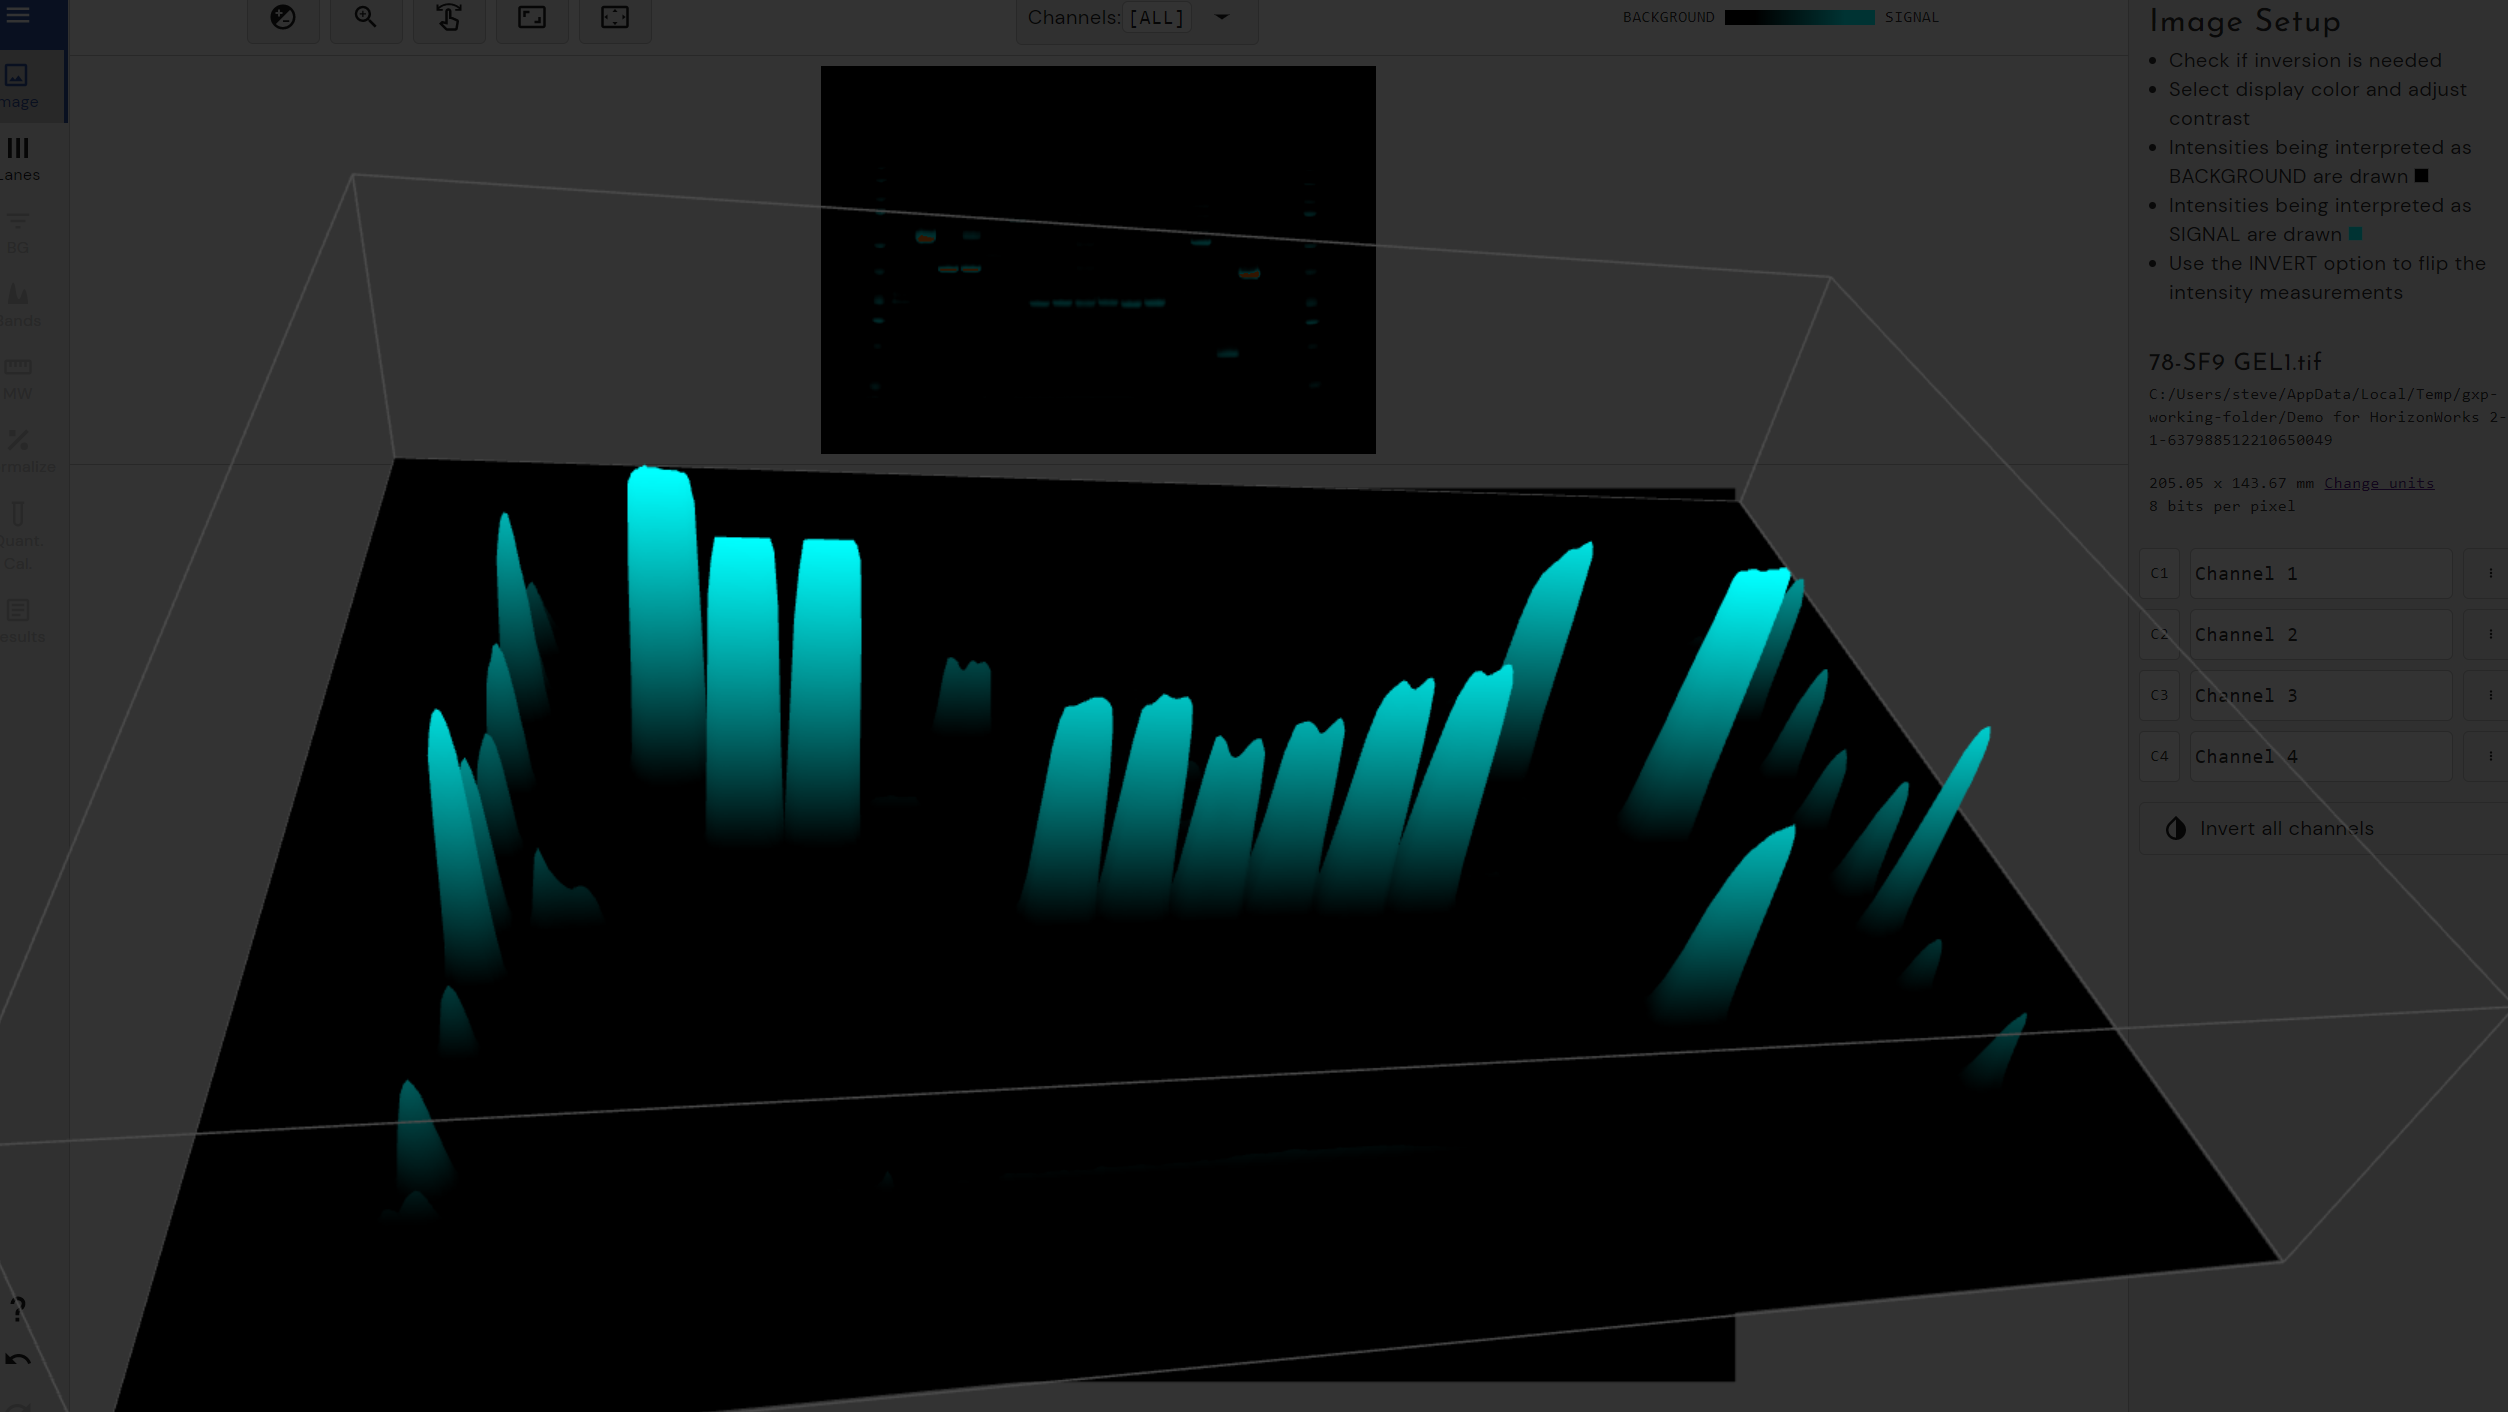
Using CLIQS, the user is prompted to set parameters such as sensitivity and background subtraction method and is able to visualise in real-time whether these settings enable all bands to be detected correctly.
For instance, there is a sliding scale for sensitivity of band detection, which identifies all the bands of interest.
A specific band may be displayed graphically and by hovering the cursor over each peak in turn. The band that each peak represents may be highlighted in green on the blot image and the synthetic lane image.
This is particularly useful when each lane contains multiple bands or the bands are obscure due to noisy edges. While viewing the peaks and the synthetic lane it is possible to easily remove and refine bands and their edges.
Dr Roz Jenkins, Principal Experimental Officer, University of Liverpool commented: “Using TotalLab’s software, the analysis of blots can be performed in approximately 30 seconds using the fully automated process. The program is easy to navigate and analyses were performed with confidence by myself and by graduate students after just a five-minute demonstration.”
Download a copy of this case study here.
Want to find out more? Request a free trial.


