SpotMap 2D is the original, industry-leading analysis software specifically designed from the ground up to automate and simplify the process of determining host cell protein (HCP) antibody coverage by 2D-PAGE and 2D Western **blot-**based techniques, including support for 2D-DIGE and 2D-DIBE. Ideal for high-throughput pharmaceutical and biotech environments, SpotMap 2D efficiently automates antibody coverage analysis, significantly reducing manual intervention, time taken for analysis and inter-operator variability.
In the regulator’s words: antibody coverage is the percentage of host cell protein spots on the 2D gel that the anti-HCP antibody reagent recognizes on the matching 2D western blot, assessed across the range of molecular weight and charge, and it is the orthogonal check used when you qualify the reagent behind your HCP ELISA (USP <1132>). SpotMap 2D reports that percentage, plus a separate score for each quadrant of the blot, so a weak corner of the map is visible rather than averaged away. For the method itself, see HCP coverage analysis using 2D western blot.
How to report SpotMap 2D in your methods: “Anti-HCP antibody coverage was determined by 2D western blot and calculated in SpotMap 2D (TotalLab Ltd, Newcastle upon Tyne, UK) as the percentage of 2D gel spots with a matching immunoreactive spot on the blot, reported overall and per quadrant.”
Key Benefits:
- Universal Compatibility: Supports 2D gel and Western Blot, 2D-DIGE, 2D-DIBE, and Immunoaffinity Chromatography (IAC). Compatible with fluorescence, chemiluminescence, colorimetric, and functional group-specific stains.
- Vendor Neutral: Supports all industry-standard scanners and image formats, including TIFF, GEL, MEL, IMG/INF, GSC, 1SC, JPEG, PNG and BMP files.
- Speed & Efficiency: Obtain accurate antibody coverage results in under 10 minutes.
- Automated & Objective: Minimizes manual intervention, ensuring consistent, reproducible results across labs and operators.
- Quantitative Analysis: Provides precise quantitation and exportable measurements of individual protein spots, provides coverage percentage to assess antibody reactivity, aiding in ELISA validation.
- Flexible Reporting & Visualization: User-configurable PDF reporting for easy documentation and compliance, multichannel color overlays, 3D views with spot labels, and enhanced visualization tools.
- Compliance-Ready: Fully integrates with AuditSafe for complete 21 CFR Part 11, EudraLex Annex 11, and GAMP3 regulatory compliance, making it a fully compliant 2D-PAGE HCP coverage solution.
 Developed through close collaboration with the pharmaceutical industry, SpotMap 2D delivers accurate, reproducible, and rapid HCP antibody coverage analysis you can trust. You can access some real-world case studies, posters, application notes, and technical evidence showing how SpotMap 2D is actively helping some of the world’s largest pharma companies here.
SpotMap 2D is trusted to automate HCP antibody characterization by the world’s largest pharmaceutical, biotechnology, chemical and academic institutions worldwide:
Simple, Quick, Reproducible Workflow
SpotMap 2D doesn’t try and force you into a specific workflow or to perform your analysis in a certain order or way, rather it simply provides all the tools you may require for host cell protein coverage analysis in an easy to use sandbox format. You know your experiment and your analysis better than any software ever could and we respect that.
Easily Import Your Images:
- Click and drag multiple images straight into SpotMap 2D to start analyzing
- Replicates of HCP-antigen/anti-HCP antibody image pairs can all be analyzed as part of the same overall experiment file
Edit Your Images:
- If needed, edit your images directly in SpotMap 2D, all whilst preserving the .TIFF metadata associated with the image (calibration information, pixel density, scanner information and settings etc.)
- Crop, adjust contrast, flip, rotate or invert your images to get the best image for your analysis (our guide to imaging 2D gels covers the scanner settings to get right before import)
Automatically Align Your Images:
- TotalLab’s industry leading, next-generation pixel-level alignment-based approach overcomes the positional variation introduced using 2D gels, guaranteeing 100% matching of all spots with no missing values.
- Align gel and blot images or gel to gel images (or any combination!) within seconds
- Users can also add their own manual alignment vectors in combination with automatic vectors to improve upon alignment in particularly tricky gel + blot pairs
Automatically Detect Your Spots:
- SpotMap 2D employs industry leading, in-house developed next-generation imaging techniques to automatically detect all of the spots within your selected image
- Detect and quantify spots on all images, at the same time, using only one source image to generate a common spotmap that propagates to all images within your project
- User configurable parameters of smoothing and spot peak sensitivity
- This approach, combined with our rigorous alignment algorithms, gives you confidence that you’re viewing the exact same spot location on every image
Edit Your Spots:
- Users have full access to a suite of manual spot editing tools to add, remove, split or merge spots quickly and easily if required
Easily Mark Spots as Present or Absent:
- Every spot on the master spotmap is categorized as present or absent on each image, with color-coded overlays showing at a glance which spots are common, missing or additional between your gel and your blot
- Toggle a spot and the coverage percentage recalculates immediately, so you can see exactly what a borderline call does to your reported score before you commit to it
- Set presence or absence objectively across the whole spotmap using filters on area, volume or peak height, rather than clicking through spots one at a time
Get Your Coverage Score:
- Accurate coverage score is defined either by spot number or spot volume, a single % score is reported for your experiment for confident reporting – no uncertainty
- Automatically separate your gels or blots into quadrants and see a separate coverage score for each, showing you antibody performance at high/low molecular weights and isoelectric points
Generate your .PDF report:
- Data access tool allows you to customize your own report, including deciding which images to include and how to display your HCP coverage score
- Export directly to .PDF
Why Choose SpotMap 2D?
SpotMap 2D is specifically designed from the ground up to analyze coverage – the percentage of immunoreactivity that an anti-HCP antibody has for the total population of HCPs present – rather than being repurposed 2D proteomics based software. It does this by comparing 2D gel or blot images of proteins detected with an anti-HCP antibody (i.e., a secondary image) against an image revealing all HCP antigen proteins (i.e., a primary image). SpotMap 2D is not limited to just comparisons between 2 images however, with the universal spotmap propagating to all images within a project. This allows users to compare multiple different blots and gels representing different antibodies, batches etc. simultaneously for quicker and easier candidate antibody selection. HCP coverage analysis can be useful in many applications:
- Development of analytical methods (choice and validation of immunoassay reagents)
- Selection and validation of the most appropriate generic HCP ELISA kit for your specific workflow
- Bridging studies to support assay replacement (e.g. change from commercial assay to platform assay or process-specific assay)
- Generic assay revalidation for every new batch of reagent
- Process- and platform-specific assay revalidation after changes that could affect HCP composition
- Optimization of bioprocesses
The images used for coverage assessments can be generated from a host of different experimental workflows and SpotMap 2D supports all 2D-PAGE based practices including conventional 2D gel electrophoresis and Western Blotting, 2D differential in gel electrophoresis (2D-DIGE) and Immunoaffinity chromatography (IAC) followed by 2D differential in gel electrophoresis (2D-DIGE). Our SpotMap software has been in active development for more than a decade and in that time has been cited numerous times in proteomics and anti-HCP antibody generation best practice guides within the field (click to open):
Vendor-Neutral 2D-PAGE HCP Coverage Analysis Software
Seamless Compatibility with Your Existing Lab Equipment—No Hardware Lock-In
When it comes to 2D Western blot and HCP coverage analysis, flexibility matters. Unlike competitor software, SpotMap 2D is truly vendor-neutral, supporting a wide range of image file types, including TIFF, GEL, MEL, IMG/INF, GSC, 1SC, JPEG, PNG and BMP files, ensuring you can analyze high-quality images from virtually any instrument. It seamlessly integrates with nearly any scanner, densitometry system, or gel documentation device on the market. Whether you’re working with a Cytiva Typhoon™, Sapphire FL Biomolecular Imager, Bio-Rad Gel Doc™, Fujifilm LAS™, or any other imaging system, SpotMap 2D adapts to your existing lab setup—not the other way around.
Officially Recommended by Merck for use with their Auto2D devices, SpotMap 2D gives scientists complete freedom in how they capture and analyze their HCP coverage data (click to read the full technical note):

Make the Smart Choice for Your HCP Analysis
Stop letting hardware compatibility dictate your software choices or workflows. With SpotMap 2D, you get complete freedom to use the imaging systems that work best for your lab—without compromise.

High DPI Image Export for Presentation, Publication or Reporting
Present your 2D images, your way, using SpotMap 2D’s data access tool. Our multichannel color overlay image allows you to blend multiple images together to easily visualize similarities and differences between your 2D gels and Western blots. High DPI export to basically any other piece of software means you can share our easy to interpret display mode with colleagues or customers easily.
And of course, you can fully customize your report with the images you choose – raw grayscale, annotated, multichannel overlay, spot outline on/off, your call.
Customize Your Reports Including Full Audit Trails and Data Integrity Checks
- Automatically generate a comprehensive report of your entire analysis, including original images, summarizing all essential quality control checks, analysis parameters, results, images, tables and coverage charts in a single document. A detailed spot measurements table can also be appended to your report
- Easily visualize and export critical analysis parameters such as position of alignment vectors and spots that were excluded or edited
- Save, print or copy to clipboard all project data, tables and images (2D and 3D views, graphical reports, display area, application window)
- Carry out pI/MW calibration to help interpretation of mass spectroscopy-based identification data
SpotMap fully complies with:
When integrated with our AuditSafe compliance module, users are able to control system access through unique passwords or Windows Active directory integration, record user activity, define users define project sign-off procedures to ensure compliance with various QC/QA requirements.
Greater Coverage Accuracy, Reduced subjectivity
Complex sample preparation and running procedures cause distortions such as faint spots, overlapping spots, saturated spots and streaks. You can overcome these challenges during your analysis easily within SpotMap by enhancing these visual distortions using our range of advanced visualization tools, allowing a more informed and confident decision where necessary. Our tools include interactive 3D views, user configurable secondary image overlay (multichannel overlay) or full color overlay mode. See your host cell protein expression data like never before. Our multichannel color overlay lets you blend multiple images with your preferred color scheme to easily visualize similarities and differences between 2D gels and blots.
Automated Quadrant Coverage Analysis for Precise HCP Antibody Validation
Pinpoint Antibody Performance with Confidence — No Manual Setup Required
In 2D Western blot-based Host Cell Protein (HCP) coverage studies, understanding how your ELISA antibody performs across diverse protein subsets is critical-especially for low-molecular-weight, low-immunogenicity HCPs that often evade detection. That’s where SpotMap’s automated quadrant analysis can put you ahead. Unlike competitor tools, which require manual definition of quadrant parameters, SpotMap automatically and accurately splits your blot into coverage quadrants, enabling faster, more consistent evaluations with zero guesswork or user variability.
What Makes SpotMap 2D’s Quadrant Coverage Analysis the Best?
- Automatic Quadrant Generation
No need to manually configure boundaries-SpotMap 2D applies intelligent defaults and also allows user-customizable ladders for MW and pI to immediately assess antibody coverage across defined protein subsets.
- Accurate HCP Antibody Coverage by Protein Subgroup
Quickly evaluate which areas of the blot-high MW, low MW, acidic or basic-isoelectric point-show suboptimal antibody recognition, helping you focus your host cell protein antibody development improvements where they matter most.
- Reduced Inter-Operator Variability Automated quadrant splitting ensures that every researcher, across every site, performs analysis using the same quadrant parameters, increasing reproducibility and regulatory confidence.
- Visual Histograms with Instant Interpretation SpotMap 2D highlights coverage range variability per quadrant with clear circular charts that can be exported for reporting, allowing you to instantly spot any gaps in your host cell protein antibody coverage.
Why Scientists Choose SpotMap 2D
While competitors offer the ability to perform quadrant-based analysis, their workflows require manual configuration and are more prone to user bias and inconsistency. SpotMap 2D gives scientists a smarter, faster path to accurate antibody validation.
Whether you’re validating a new anti-HCP ELISA or optimizing existing assays, SpotMap 2D delivers unmatched clarity and reproducibility.
Optimize your host cell protein analysis workflow
We use intuitive, automated algorithms and an easy-to-use interface to enable users to obtain an accurate coverage percentage in around 10 minutes. This enables users to achieve extremely reproducible antibody-to-host cell protein coverage, even between different users and labs. It provides reliable, accurate quantitation of gel and blot images so that you can achieve objective results. Users are also able to verify host cell protein antibody reactivity, giving you a more complete understanding of the antigen quality. To see how 2D Western blot coverage compares with 2D-DIGE, antibody affinity extraction and ELISA-MS, read HCP antibody coverage methods compared. If you’re looking for software to support HCP coverage analysis, make bioprocess improvements or achieve analytical development then request a free demo of SpotMap. You’ll receive guidance on how to achieve reproducible results, tips for aligning challenging gels and Western blots and knowledge on the software tools to use on more challenging images, such as faint spots. 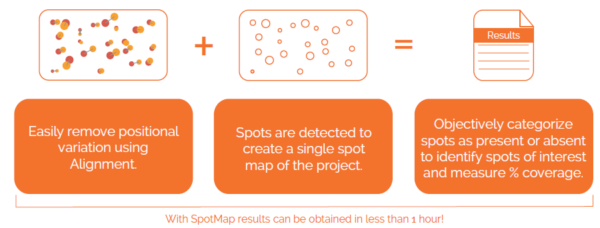
Identify and exclude Antibody Cross-reactivity from your Host Cell Protein Coverage %
In some cases your anti-HCP antibody can have non-specific binding with your drug substance or other product within your sample, leading to an artificially inflated coverage score as these spots are included within the reported coverage % but are not actually detected host cell proteins.
If you know your therapeutic drug substance exhibits some cross-reactivity with your anti-HCP antibody, SpotMap 2D allows you to detect those spots and treat them separately to the “true” HCP positive spots using its innovative Product Spots function.
Simply mask the area on the blot image where your drug substance spots appear (based off either experience from previous runs or from the pI and MW ladder information present in the image) and SpotMap 2D will allow you to create a new group of spots from those product spots. You can now toggle their inclusion using the standard spot sets controls to see how their inclusion would have inflated your overall anti-HCP coverage % score. SpotMap 2D allows you to simultaneously increase accuracy in analysis whilst accounting for antibody cross-reactivity.

How to Purchase
The best way to ensure you’re purchasing the latest version of SpotMap with the highest level of technical support is directly from us here at TotalLab by using the contact us form. We can accept payment in GBP (£), USD ($) or EUR (€). We do appreciate that some of our customers prefer sourcing products locally in a local currency or prefer to deal in their native language which may not be English. To facilitate this, TotalLab work with a global network of authorized distributors which you can find here.
SpotMap 2D FAQs
What is SpotMap 2D used for?
SpotMap 2D is software for host cell protein (HCP) antibody coverage analysis using 2D gel electrophoresis and 2D western blots. It calculates the coverage percentage of anti-HCP antibodies, a key step in validating HCP ELISA reagents for biologics.
How does SpotMap 2D calculate HCP antibody coverage?
SpotMap 2D compares spot patterns between a total protein 2D gel and the corresponding 2D western blot, automatically matching spots and reporting the percentage of host cell proteins recognized by the antibody reagent. Alignment of the blot to the gel is automatic; see 2D gel image alignment explained for how it works and how to check it.
Is there a free trial of SpotMap 2D?
Yes. A free trial of SpotMap 2D is available from TotalLab so you can evaluate it on your own 2D gel and western blot coverage data.
Resources
SpotMap has been used in published host cell protein coverage work across the biopharmaceutical industry. Browse the SpotMap reference papers.

 SpotMap 2DHCP antibody coverage by 2D western