
SpotMap 2D Software Case Studies & Evidence for Host Cell Protein (HCP) Coverage

User Testimonials and Success Stories
We work closely with our customers from across the globe to ensure they get the best from SpotMap 2D.
To help you to evaluate SpotMap 2D for your projects we can provide you with a demonstration of the software using your own images from your own lab and fully support you throughout a free trial of the software.
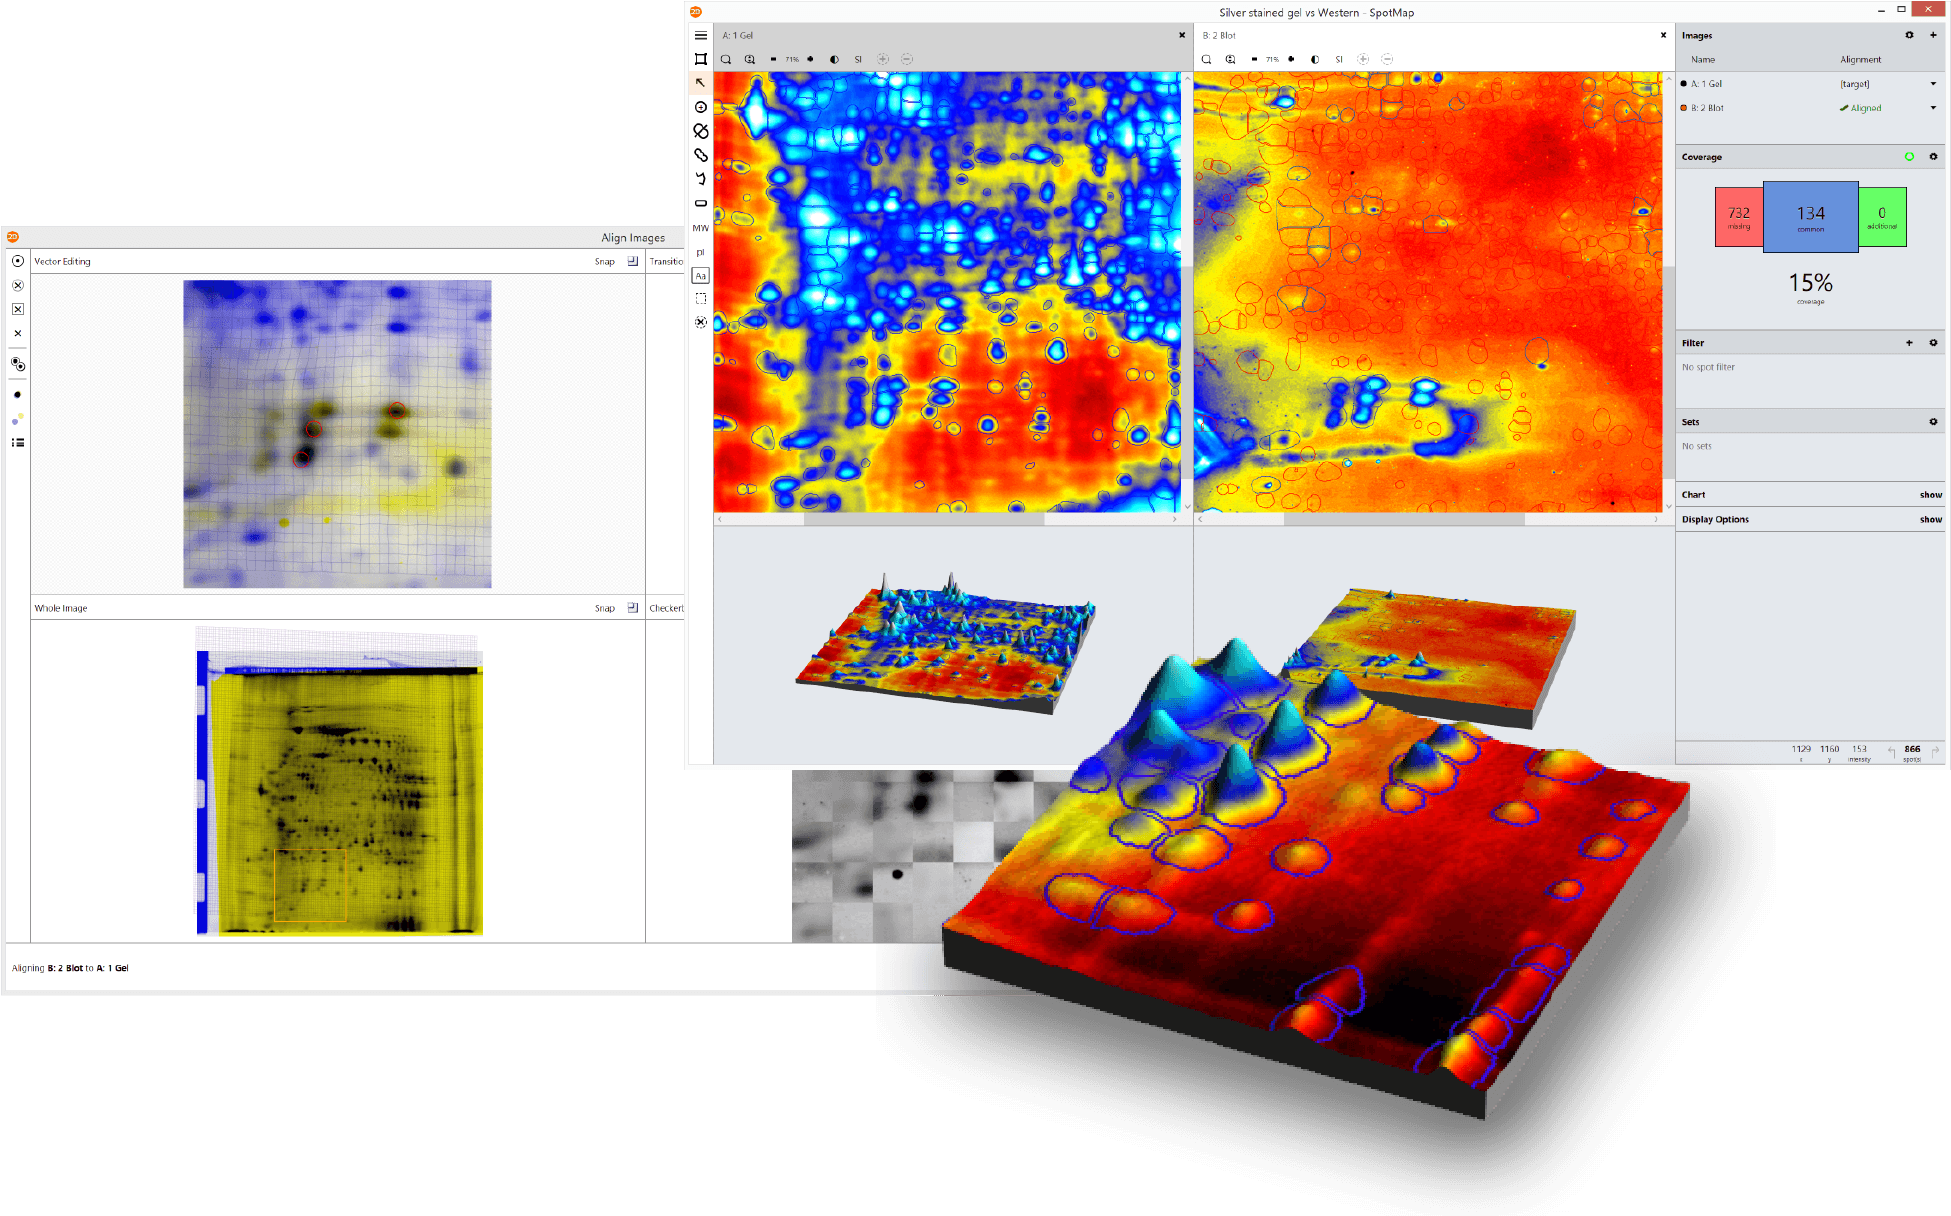
Welcome to our comprehensive resource showcasing real-world case studies, posters, application notes, and technical evidence demonstrating how SpotMap 2D software from TotalLab supports accurate, reproducible host cell protein (HCP) coverage analysis. Learn how laboratories worldwide rely on SpotMap 2D to accelerate data analysis, improve quality control, and reduce inter-user variability.
Key Benefits Highlight
- Fast, reliable HCP coverage analysis: See how SpotMap 2D compares and outperforms traditional methods in time and accuracy.
- Proven reproducibility: Studies from leading institutions highlight low inter-user and inter-lab variation.
- Regulatory compliance: SpotMap 2D reports include audit trails supporting 21 CFR Part 11 compliance.
- Trusted by experts: Read testimonials and case studies from global research labs and pharmaceutical companies.

Case Studies (Click to Enlarge)
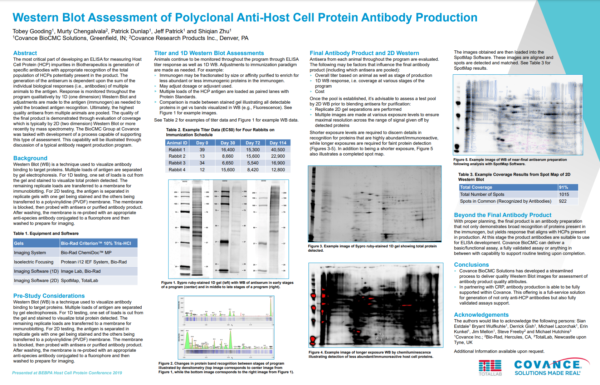
Case Study: Western Blot Assessment of Polyclonal Anti-Host Cell Protein Antibody Production, Covance BioCMC (Now LabCorp)
Case Study: University of Aberdeen, Proteomics Core facility
“The proteomics core facility provide protein analytical services to academics and companies, mostly in the local area but also worldwide. We offer a wide range of services to try and accommodate any needs, these can vary from simple protein identifications to large scale gel/mass spec experiments. Currently we are mainly offering services in: Gel electrophoresis (1D, 2D, DIGE), In-depth proteome analysis (Q-Exactive LC-MS), molecular histology (MALDI- imaging), protein identification/quantification, mapping of protein modifications and rapid microbial identification (MALDI Biotyper).”
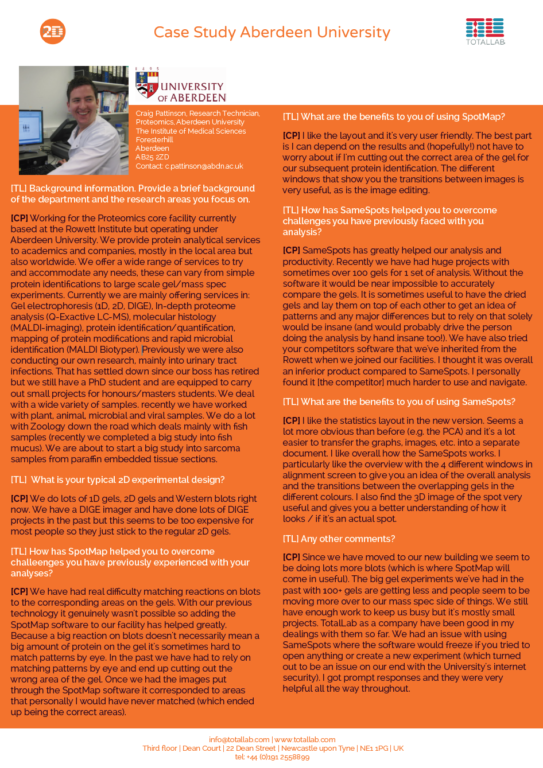
“We have had real difficulty matching reactions on blots to the corresponding areas on the gels. With our previous technology it genuinely wasn’t possible so adding the SpotMap 2D software to our facility has helped greatly. Because a big reaction on blots doesn’t necessarily mean a big amount of protein on the gel it’s sometimes hard to match patterns by eye. In the past we have had to rely on matching patterns by eye and end up cutting out the wrong area of the gel. Once we had the images put through the SpotMap 2D software it corresponded to areas that personally I would have never matched (which ended up being the correct areas).”
Craig Pattinson, Research Technician, Proteomics, Aberdeen University
Case Study: Rockland Immunochemicals SpotMap 2D vs PDQuest for 2D-SDS PAGE Analysis For Determining HCP Coverage
Poster, originally presented at the WCBP 2016 conference: “2D-SDS PAGE Analysis Methods For Determining HCP Coverage Using Process Derived anti-HCP Polyclonal Antibodies”
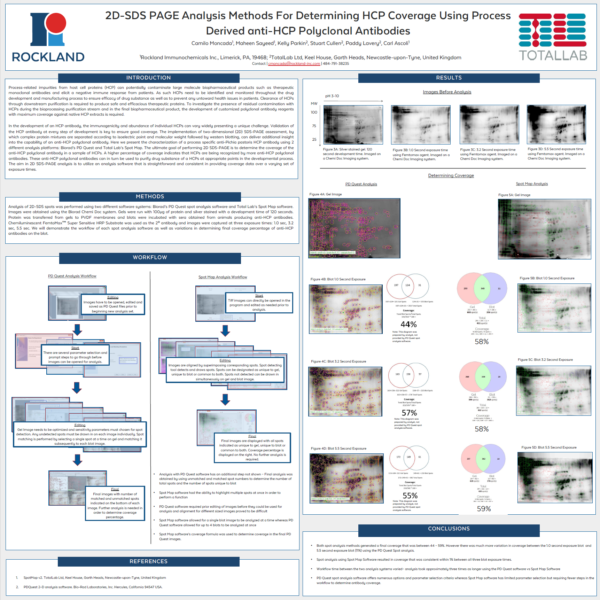
“Both spot analysis methods generated a final coverage that was between 44 – 59%. However there was much more variation in coverage between the 1.0 second exposure and 5.5 second exposure (11%) using the PDQuest Spot analysis. Spot analysis using SpotMap 2D resulted in coverage that was consistent within 1% between all three blot exposure times. Workflow between the two analysis systems varied by about 2 hours – analysis took approximately 1 hour using the SpotMap 2D software and approximately 3.5 hours using the PDQuest software. PDQuest spot analysis software offers numerous options and parameter selection criteria whereas SpotMap 2D software has limited parameter selection but requiring fewer steps in the workflow to determine antibody coverage.”
Case Study: Minimising Inter-User Variation in Coverage of 2D Gels
This report demonstrates the inter-user variation of SpotMap 2D used by three individuals of varying experience on three data sets categorized as hard, medium and easy. Results obtained were within a range of 10% of each user, even when the most challenging images were used. Key areas of the analysis where variation may be introduced have been identified.
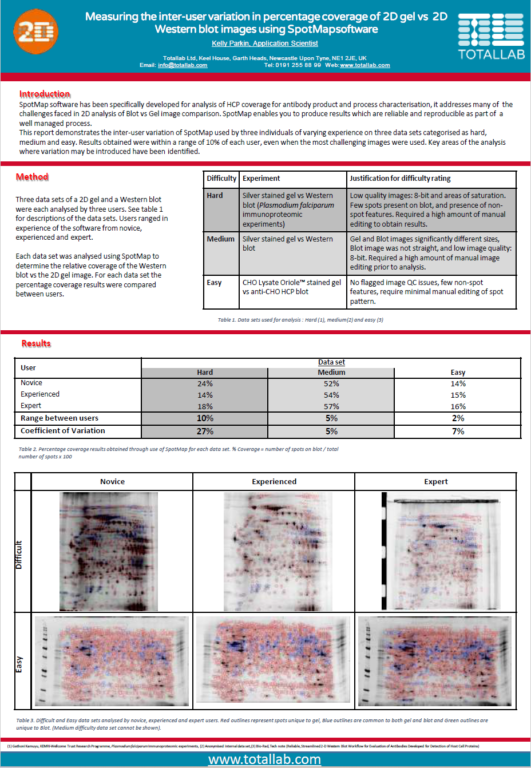
“Typically with 2D gels and Western blots the biggest source of variation is the image quality. The automatic image QC flagged two of the data analysis results as being potentially imprecise due to the use of 8-bit images. Smearing/steaking, saturation and presence of non-spot features also affects analysis precision.
There are areas of the analysis that require particular consideration to improve objectivity and precision. Within the software, image editing, alignment vectors added, spot detection parameters used and individual decisions on the presence of a spot will all impact the results.
However, SpotMap 2D gives reproducible and reliable results within a range of 10%, even using challenging images. The use of high quality images which enable a consistent analysis approach between users will reduce the variation, as seen in the easy data set where results are within a range of 2%. Production of an SOP that addresses all aspects of the analysis, including optimized gel running and image capture would increase the objectivity of the results, reducing the subjective decisions required during analysis.”
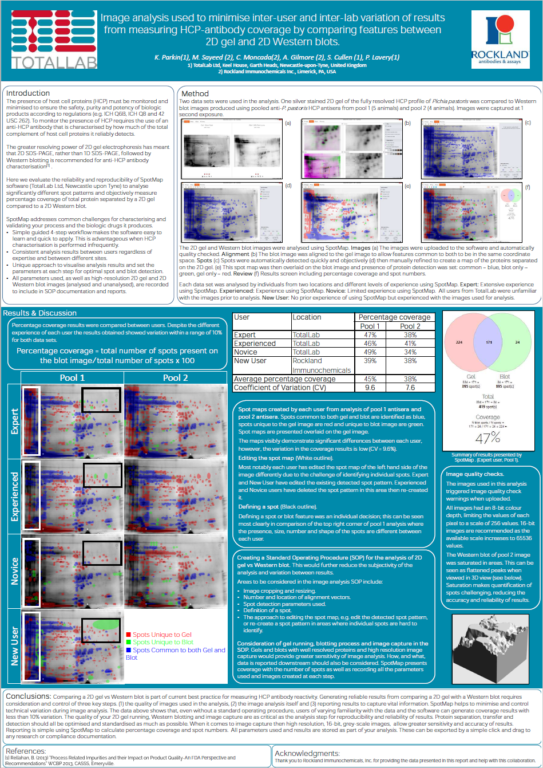
Case Study: Image analysis used to minimize inter-user and inter-lab variation of results from measuring HCP-antibody coverage
Poster, originally presented at the WCBP 2018 conference: “Image analysis used to minimize inter-user and inter-lab variation of results from measuring HCP-antibody coverage by comparing features between 2D gel and 2D Western blots.”
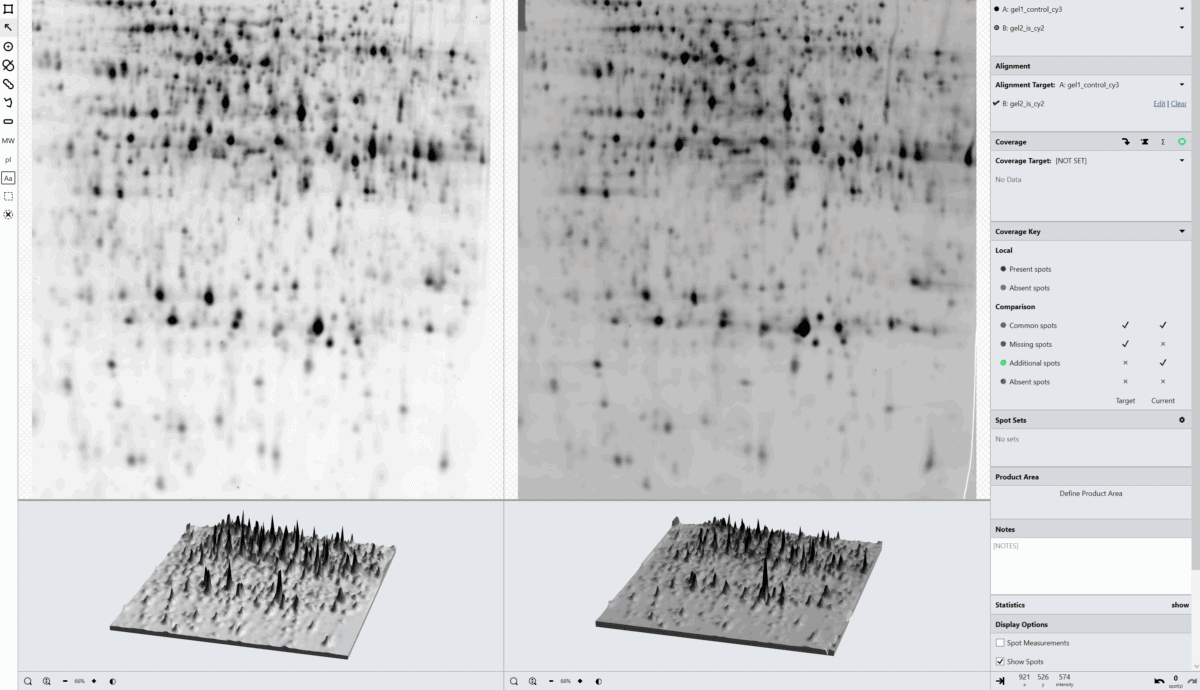
Host cell protein (HCP) coverage example analysis report based on images donated by University of Cambridge
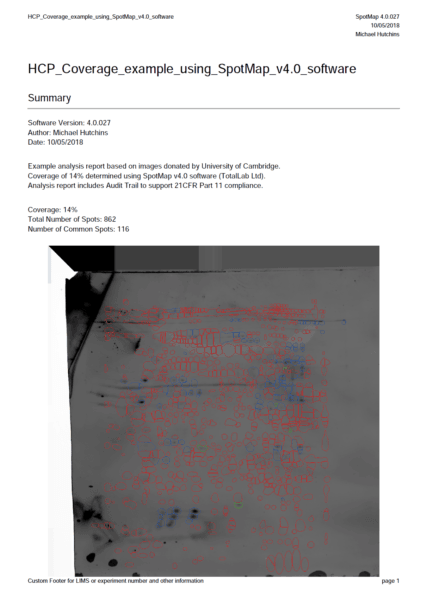
A full analysis was performed and a report was generated using SpotMap 2D in under an hour including an audit trail to support 21 CFR Part 11 compliance.
Interested in experiencing SpotMap 2D for your lab? Request a free software demonstration or start a trial today to see how TotalLab can transform your host cell protein analysis workflow.