SameSpots: 2D Gel Analysis Software for Differential Protein Expression

Click Here For Your Free Trial!

What is 2D Gel Analysis?

Two-dimensional gel electrophoresis (2D-PAGE) is a core technique in proteomics for separating and comparing complex protein mixtures. Proteins are first separated by their isoelectric point (pI) using isoelectric focusing (IEF), then separated a second time by molecular weight using SDS-PAGE — producing a two-dimensional map of protein spots that represents the proteome of your sample.

When the same technique is applied across multiple samples — for example, comparing treated versus untreated cells, healthy versus diseased tissue, or different time points in a longitudinal study — the resulting gel images can be aligned and analyzed to identify proteins that change in abundance between conditions. These differentially expressed proteins are candidates for biomarkers, drug targets, or indicators of biological state.

Two-dimensional difference gel electrophoresis (2D-DIGE) is an advanced variant of 2D-PAGE in which two or more protein samples are labelled with spectrally distinct fluorescent dyes (typically Cy2, Cy3, and Cy5) before being co-resolved on the same gel. This eliminates gel-to-gel variation between samples, dramatically improving reproducibility and statistical confidence.

Analyzing 2D gel and 2D-DIGE images accurately requires specialist software capable of automatically aligning gel images, detecting and matching protein spots across all images in an experiment, normalizing abundance data, and applying appropriate statistical tests to identify genuinely significant expression changes. SameSpots was built specifically for this purpose.

"SameSpots has greatly reduced the time needed for 2D-DIGE analysis. I can now complete an analysis in less than one-quarter of the time that it would have taken when using the previous supplier's software, while at the same time obtaining more consistent and reliable results due to the excellent gel alignment and spot matching features. SameSpots is also very easy to use and makes spot editing across gels as simple as just one click, rather than having to visit each gel individually to make all of the changes. I have no doubt that SameSpots will very quickly pay for itself in the terms of salary time alone."

Todd M. Umstead
- Pennsylvania State University College of Medicine

Why SameSpots is the Most Reliable 2D Gel Analysis Software for Proteomics

SameSpots (previously Progenesis SameSpots) overcomes the common problems you face when using 2D gel electrophoresis proteomics work to identify differential protein expression analysis. These include a lack of reproducibility in your results, hours of tedious spot editing and alignment and a lack of confidence in the resulting statistical significance of protein expression changes.

SameSpots offers all the functionality you need to analyze experiments consisting of conventional 2D gels, 2D Western Blots, 2D-DIGE and 2D-DIBE gels all within a single package so that you can fully exploit the advantages offered by multiplexing with no upsells or add-ons. Our software offers:

  • Simplicity. You are guided through each step of the workflow, new users can get up and running with minimal training.
  • Speed. Typical analysis times of less than 5 minutes per gel with single-stain or 2-DE DIGE images.
  • Objectivity. A consistent analysis approach that is proven to give reproducible results between different users.
  • Statistical power. Our next generation pixel-level image alignment algorithms deliver 100% matching with no missing values in your data for valid multivariate statistics.
  • 21 CFR or GMP-compliance. When combined with our AuditSafe software, allows users to meet and even exceed FDA 21 CFR part 11, EudraLex Annex 11, GAMP4 or more general GMP standards/ALCOA principles for compliance within regulated or QC environments, from captured image all the way through to final analysis and report production.

SameSpots is tested and compatible with Windows XP, 7,8,10 and 11.

Our SameSpots software is trusted by the world’s leading educational, industrial and pharmaceutical companies:

SameSpots 2D gel analysis software is trusted by leading institutions including NIH, AstraZeneca, Roche, University of Cambridge, Institut Pasteur, Max Planck Institute for Biochemistry, Johnson & Johnson, Regeneron, Australian Proteome Analysis Facility, and 100+ academic and pharmaceutical organizations worldwide

2D Gel Analysis Software SameSpots

I used SameSpots in an advanced undergraduate biochemistry laboratory focusing on responses to acute stress. My students were a bit intimidated by the software at first, but rapidly picked up the underlying concepts and quickly found the workflow to be quite intuitive. By the end of the process, they were excited to see which proteins on their 2D gels SameSpots had determined changed significantly in response to their experimental stresses. The ease of use and statistical power of SameSpots was central to our ability to link environmental stress to changes in protein expression.

Peter A. Fields
- Professor at Franklin & Marshall College

What Makes SameSpots Different from Other 2D-DIGE & 2D-PAGE Analysis Software?

SameSpots is an all-in-one software solution for the visualization, matching, detection, quantitation, and analysis of 2D gels, 2D Western Blots, 2D-DIGE and 2D-DIBE gels. Our software helps scientists investigate biological processes by characterizing samples in terms of relative protein abundance and post-translational modifications and has been designed to accurately detect statistically significant differences in protein expression between experimental groups, with high objectivity, sensitivity and reproducibility.

Protein expression analysis can be used in many applications:

  • Discovery of novel biomarkers (proteins or protein patterns associated with a specific biological state)
  • Development of diagnostic tests
  • Study of the effect of certain compounds (e.g. drugs) or conditions on proteins expressed by an organism.
  • Quality control of food samples
  • Investigation of structure and function of proteins

SameSpots supports differential protein expression analysis for a wide range of 2D-PAGE based methods including Conventional 2D gel electrophoresis and Western Blotting, 2D differential in gel electrophoresis (2D-DIGE), using an internal standard, Two-dimensional Differential In Blot Electrophoresis (2D-DIBE) and other multiplexed technologies without an internal standard.

As a truly vendor neutral solution, SameSpots supports all common experimental detection agents, including fluorescence, colorimetric and functional group-specific stains. Similarly, all industry-standard image formats can be analyzed.

SamesSpots 2D PAGE Analysis Software
SameSpots Image QC
SameSpots 2D-PAGE 3D Spots
SameSpots 2D Gel Analysis Software PCA Statistics
SameSpots MW and pI calibration

"As Chief Scientist at aiwell Inc., I have had the privilege of utilizing SameSpots software to significantly enhance our biomarker detection workflows. The precision in image alignment and spot detection offered by the platform has greatly improved the accuracy and reproducibility of our proteomics data, even when working with complex samples. The intuitive interface has streamlined the comparison of gel images and the identification of significant differences.

The technical support team has also been exceptional—always responsive, helpful, and quick to resolve any issues that arise."

Rehab
Chief Scientist, aiwell Inc.

Automatic 2D Gel Alignment with 100% Spot Matching and No Missing Values

SameSpots uses a next-generation alignment-based approach to overcome positional variation introduced during the running and imaging of 2D gels which would typically prevent accurate comparison across multiple gels in large-scale proteomic experiments. These algorithms guarantee 100% matching of all spots with no missing values like those experienced in older pieces of 2D analysis software.

The software then uses intelligent automation to automatically detect all of your protein spots and copy a single spot pattern across all images which ensures a high degree of analytical objectivity and reproducibility as well as eliminating laborious spot editing typical to other pieces of spot-matching software.

Due to the automated workflow, the software is simple-to-use and easy-to-train on – typically taking less than 2 hours for a new user to become fully trained and ready to produce accurate results. Our advanced automation also means that the analysis of a full dataset of images (usually up to 24 images) typically takes less than an hour.

2D Electrophoresis Automatic Spot Detection
2D Gel Electrophoresis Automatic Alignment
Compare Proteins Across 2D Gels
2D SDS-PAGE PCA Analysis

"We moved from competing software to SameSpots as it gives much more robust analysis of DIGE experiments - no ‘missing data’ issues and lots of statistical tools. The other major factor in our decision is that TotalLab is continually improving the software and works closely with customers to respond to their needs and suggestions."

Mike Dunn
- Professor of Biomedical Proteomics, UCD Conway Institute, Ireland and Vice-President of the British Society for Proteome Research, Dublin, Ireland

Built-in Multivariate Statistical Analysis and Reporting

SameSpots is adaptable to your original experimental design, meaning you can perform full image and statistical analysis of your 2D proteomic studies within the same piece of software. This produces a comprehensive report that highlights to users when significant changes in protein expression are observed.

SameSpots currently supports the following types of experimental design and associated statistical analysis:

Between-subject Design (one-way ANOVA)

Do samples from your subject appear in only one condition (for example, only in a control group)?
Samples are grouped according to experimental condition (defined by the user) and an ANOVA test is performed to identify any significant changes in protein expression between those groups. The ANOVA calculation assumes that the conditions are independent and therefore gives a statistical test of whether the means of every single spot within all conditions is equal.

Within-subject Design (repeated measures ANOVA)

Have you taken samples from a given subject under different conditions?
This specialist repeated ANOVA test allows the user to tell the software what experimental condition the sample came from along with the unique subject that the sample came from, ideal for longitudinal experiments where every subject has been sampled at every time point.

Two-way ANOVA Design

Do your samples from a given subject appear in two different conditions?
The two-way ANOVA allows users to determine whether the effect of one of your independent variables (e.g. drug treatment A) on your dependent variable (e.g. protein expression) is the same for all values of your other independent variable (e.g. drug treatment B) and vice versa. This enables large scale clinical proteomic work to be performed between different drug treatment profiles and their effects on biomarker expression (significant or not).

Our software is regularly used in agricultural proteomics so the above studies can also be applied to testing variables such as genetically modified seeds, disease resistance, plant supplements etc.

2D Electrophoresis PCA
2D Proteomics

"We currently use SameSpots for our research projects and for training/teaching students on our MSc Genetics and Multiomics in Medicine programme. The software is extremely user-friendly and simple to navigate. The algorithm used for spot detection and spot matching across gels is fast and accurate. Very little manual editing is necessary, hence increasing the confidence of the statistical analysis without bias. The in-built statistical packages is straightforward to use and easy to interpret.

What sets SameSpot apart is the unparalleled support provided from the sales team of TotalLab. Dr Steven Dodd, Head of Sales and Business Development, has always been there to provide continuous support to the students and myself in answering queries, concerns etc.”

Vaksha Patel
- Head of Genetics and Multiomics in Medicine Master's course, UCL, London

Delivering Confidence in Your 2D Gel Electrophoresis Image Analysis

The software is easy to use, with our experienced team providing you with a guided walkthrough of the workflow so you can quickly get to grips with the 2D gel electrophoresis image analysis software.

Once up and running, typical analysis takes just five minutes per gel with either single-stain or 2D DIGE images.

Quick tags can also be used: these are useful for quickly highlighting proteins that show significant changes in expression. Therefore, you can focus your attention on these ‘interesting’ spots for further analysis with mass spectrometry. You can also import protein identification from mass spectrometry, from databases such as MASCOT or your own custom-made databases, back into your 2-DE analysis and report alongside quantitative results.

2D SDS-PAGE Protein Spot View
2D SDS PAGE Principal Component Analysis

SameSpots is user-friendly and straightforward. Therefore, the analysis is 4x faster compared to the competitor software. The minimal user intervention that is necessary to perform the analysis speeds up the process and ensures reproducibility of the results independent of the individual user. SameSpots will enable us to set up a rapid 2D gel analysis workflow to generate exact and highly reproducible data in our lab.

Dr Katja Schlink
- Research Centre for Agriculture and Forestry, Laimburg, Italy

Generate Picking Lists for Downstream Analysis

Once you’ve completed your analysis and identified proteins of interest within your experiment, what next? SameSpots fully supports d0wnstream protein identification via in-cell digestion and mass spectrometry via the export of industry standard picking lists.

SameSpots is also compatible with the majority of spot picking robots such as the Cytiva Ettan Spot Picker,  exporting picking lists in their required file types to automate the process of protein retrieval from 2D SDS PAGE gels for proteomics based mass spectrometry and identification.

SameSpots is also able to generate manual picking templates for users to place underneath their 2D Gels for manual spot excision, digestion and mass spec analysis.

Ettan Spot Picker 2D Gels

How do we compare to the competition?

We’ve written several comparison guides comparing our software to the other 2DE Proteomic analysis software on the market to show why we’re confident we’re the best option for your lab:

Why Upgrade from DeCyder to SameSpots?
Why Upgrade from PDQuest to SameSpots?

And independent comparisons by experts between our software and our competitor’s has even been published in well respected journals – What’s the Difference? 2D DIGE Image Analysis by DeCyder versus SameSpots

Samespots vs DeCyder vs PDQuest

In fact, when Bio-Rad officially discontinued their PDQuest software, they actually recommended their existing users transition to our SameSpots software – “We have evaluated the software and found it to be comparable to our software and should will suite your needs for 2D analysis and beyond.”

"Although the image upload and project generation is comparable for DeCyderTM and SameSpotsTM, handling of the latter is more intuitive for the user due to fewer instances of user intervention (with respect to possibility and necessity) as well as its nonmodular structure allowing for a clear and coherent workflow, as reported previously [Silva et al., 2010]. Furthermore, markedly less time has to be invested for quantitative analysis since the warping technique combined with image alignment prior to coherent spot detection supersedes the time-consuming spot matching recommended in the case of DeCyderTM

Paul Dowling,
- National Institute for Cellular Biotechnology, Dublin City University

Case Studies

Case Study: University of Texas Medical Branch, Biomolecular Resource Facility

The University of Texas Medical Branch, Biomolecular Resource Facility is one of only seven sites within the USA that receive multi-million dollar state funding by the US Department of Health & Human Services.

Biomolecular Resource Facility NHLBI Proteomics Center

“The fundamental concept (image alignment) of SameSpots permits us greatly increased confidence in quantification, and this is enhanced when performed on gels obtained by our saturation fluorescence strategy. The statistical package further enhances confidence in our quantitative studies. In addition SameSpots has increased our throughput – with the demand we experience, this results in tremendous savings in manpower and expense over a year. With the proper tools and attention to detail proteomics can reap enormous benefits whatever your field of biological study. SameSpots is one of the tools that are indisputably required — providing the image and subsequent statistical analyses that are critical to a conclusive and compelling proteomics study.”

John E. Wiktorowicz, Ph.D. Associate Professor, Dept. Biochemistry & Molecular Biology Director, Proteomics Section

Case Study: Instituto di Ricerche Farmacologiche “Mario Negri”

Founded in 1963, The Instituto di Ricerche Farmacologiche “Mario Negri” is a non-profit independent scientific organisation for biomedical research and education. “In the Environmental Health Sciences Department we investigate the effect of environmental factors on human health, focussing on the survey of environmental contaminants, the assessment of human exposure with related health.

“We have been using SameSpots in our research since January 2007. The software has drastically simplified our proteomics workflow and opens up new avenues for the exploration of the data obtained”

“Since using SameSpots the speed of our analysis has been drastically improved. We align our gels accurately within 5 mins per gel and then run the SameSpots analysis. We don’t usually perform any correction of spot detection which results in fast, robust and very reproducible analysis. This has an immediate positive effect on the quality and confidence in our results.’’

Dr Roberta Pastorelli, Head, Protein and Gene Biomarkers Unit Laboratory of Molecular Toxicology

Case Study: Cardiovascular Sciences Research Centre, St. George’s University of London

The Cardiovascular Sciences Research Centre, St. George’s University of London, is a multidisciplinary group which amalgamates clinical, surgical and basic science research expertise. The mission of the Research Centre is to understand mechanisms of cardiovascular disease.

“The main difference is the speed at which we can analyze our gels. Using SameSpots, we are able to analyze our gels in a much shorter time frame, with very little manual intervention required. Initial analysis that could take days before can now be achieved within a few hours, obviously depending on the number of gels. The results we are obtaining are extremely robust and reproducible. The matching is excellent, and hardly any manual spot editing is required. Also, the inbuilt statistics is user friendly, giving both q values, which are extremely useful to have in addition to the p values, along with the power value. The workflow is straightforward and logical, and visually appealing.”

Dr. Ayesha De Souza, Senior Research Fellow, Cardiac Proteomics, Cardiac and Vascular Sciences, St. George’s University of London, London, UK.

Case Study: Centre Paul Papin

The Centre Paul Papin is a hospital specialized in cancer treatment and cancer research. The Centre Paul Papin collaborates with the Plateforme technologique d’Angers which offers, among other things, services in proteomics to public laboratories and industry.

“With our previous software, we experienced three major problems. Firstly, despite the time we spent disposing of many landmarks on the master gel, the software made many mistakes in alignment. Secondly, when a spot was missing on the gel master, it was not detected and analysed. Finally, the software was not friendly to use and the analysis was laborious.”

“SameSpots is so convivial and intuitive that it is a real pleasure to work with. The image alignment step makes us feel secure that we have one hundred percent matching and the additional statistical tools are perfectly designed for biologists who are not specialized in statistics. The development and improvement of SameSpots has been pleasing.”

Prof Catherine Guette, Proteomics platform leader, Laboratoire d’oncopharmacologie, Nice, France

"For my Masters Class teaching at Lille University, I choose SameSpots as my favorite analysis software since it is easy to use, efficient, fast and intuitive. Its significant advantage is the statistical module! Last but not least, members of the Totallab company are very competent and reactive to solve any of my problems."

Estelle Goulas
- Université de Lille-Sciences et Technologies, France

References

Our SameSpots software has been in active development since 2008 and in that time has been cited numerous times in proteomics publications within the field. It has also been rigorously compared to other pieces of 2-DE analysis software by independent parties:

Difference gel electrophoresis springer protocols journal of proteome research


Overall, even 40 years after the invention of 2DE and 20 years since 2D DIGE, the latter represents an affordable and valuable tool for high-resolution, quantitative differential proteomics. This is because of: (i) reduced costs of fluorescent dyes (due to meanwhile multiple vendors), (ii) time-saving and easy-to-use advanced CCD camera systems, as well as (iii) intuitive workflow and fast image analysis by warped, proteome map-based software, allowing for (iv) determination of highly similar, reproducible, and user-independent protein abundance changes.”

“In summary, SameSpots outperformed the other two software packages in matching accuracy, possibly being benefited by its new approach: that is, identical spot outline across all the gels. Interestingly, the statistical analysis of the software packages was not consistent on account of differences in workflow, algorithms, and default settings. Results obtained for protein fold changes were substantially different in each package, which indicates that in spite of using internal standards, quantification is software dependent. A future research goal must be to reduce or eliminate user-controlled settings, either by automatic sample-to-sample optimization by intelligent software, or by alternative parameter-free segmentation methods.”

"I have been using SameSpots since 2014 in our both conventional 2-D gel analyses and DIGE Analyses. It allows us robust and user-friendly analyses, including gel alignment, spot picking and analysis, statistics, as well as reporting the results. Furthermore, the software has been improved since then, and we had never faced any struggles or difficulties using it."

Hasan Ufuk Celebioglu
- Associate Professor Department of Biotechnology, Bartin University, Bartin, Turkiye

Flexible Licensing Options

At TotalLab we’ve been working with pharmaceutical and academic life science customers for decades, we know that some of our users prefer offline licensing to enhance security within their sites. This isn’t a problem, all TotalLab software can be activated easily either online or offline.

Our licensing system licenses a whole computer at once, with no restrictions on the number of users who have access to the software on that computer.

Licenses can be purchased singularly for one computer or we also offer discounts on multiple license purchases at the same time if you want to cover multiple computers across your site; enabling hybrid working to perform analysis outside of the lab or to allow multiple analyses to happen at the same time.

We can also support enterprise licensing for full site-wide licenses covering large pharmaceutical manufacturing facilities and research facilities at a significant discount vs buying singular or multiple licenses.

For pricing and any other licensing related queries please contact us.

How to Purchase

The best way to ensure you’re purchasing the latest version of SameSpots with the highest level of technical support is directly from us here at TotalLab by using the contact us form. We can accept payment in GBP (£), USD ($) or EUR (€).

We do appreciate that some of our customers prefer sourcing products locally in a local currency or prefer to deal in their native language which may not be English. To facilitate this, TotalLab work with a global network of authorized distributors which you can find here.

Why Researchers Switch to SameSpots

Many of the labs now using SameSpots have switched from other 2D gel analysis software — whether that’s a legacy package, a discontinued product, or a current alternative that wasn’t meeting their needs. The most common reasons we hear are below.

Too many missing values

Some 2D gel analysis workflows detect spots independently on each image and then attempt to match them across gels, which can leave gaps in the dataset where a spot was detected in some images but not others. Missing values complicate statistical analysis and reduce confidence in results. SameSpots takes a different approach: all images are first warped into the same coordinate space, and then a single shared spot pattern is detected on a composite reference and propagated automatically to every image in the experiment. The result is guaranteed 100% spot matching with no missing values — every spot measured in every image, giving your statistics a complete and unbroken dataset.

This approach has been independently validated in peer-reviewed comparisons and is cited in over 200 proteomics publications. As one independent study concluded: “SameSpots outperformed the other two software packages in matching accuracy, possibly being benefited by its new approach: that is, identical spot outline across all the gels.”

Paying separately for DIGE support

If your lab runs both conventional 2D gel and 2D-DIGE experiments, some software requires you to purchase separate modules or upgrade licenses to access DIGE functionality. SameSpots includes full support for conventional 2D-PAGE, 2D-DIGE, 2D Western blots, and 2D-DIBE in a single license with no add-ons or upsells. Whatever gel-based proteomics technique your lab uses, SameSpots handles it.

No compliance pathway

For labs in pharmaceutical or regulated environments, 21 CFR Part 11 and GMP compliance is not optional. SameSpots integrates with TotalLab’s AuditSafe module to deliver full FDA 21 CFR Part 11 and EU Annex 11 compliance, including audit trails, electronic signatures, granular user permissions, and image authenticity verification — from captured image through to final report. Many alternative 2D gel analysis tools have no equivalent compliance solution.

Software that’s no longer supported

If you are currently using a discontinued package such as Bio-Rad’s PDQuest, GE Healthcare’s DeCyder, or DECODON’s Delta2D, you are running software that will no longer receive updates, security patches, or technical support. SameSpots is actively developed, continuously updated, and backed by a dedicated scientific support team. When Bio-Rad officially discontinued PDQuest, they reviewed available alternatives and specifically recommended SameSpots to their existing users — you can read more in our PDQuest migration guide. If you are moving from DeCyder, our DeCyder migration guide covers the key workflow differences in detail.

If any of the above sounds familiar, start a free trial using your own images, or book a free demo and we will walk you through the workflow using a dataset representative of your experiments.

How SameSpots Compares

For researchers who are actively evaluating their options, the table below summarizes how SameSpots compares to Melanie — currently the only other actively maintained commercial 2D gel analysis software for differential expression — across the features that matter most to proteomics labs.

Feature SameSpots Melanie
Conventional 2D gel analysis ✅ Included ✅ Classic module
2D-DIGE analysis ✅ Included ⚠️ Separate DIGE module required
2D-DIBE / HCP coverage analysis ✅ Included ⚠️ Separate Coverage module required
2D Western blot analysis ✅ Included ✅ Included
100% spot matching / no missing values ✅ Automatic via warping ✅ Via matching, manual editing often needed
Built-in ANOVA (one-way, two-way, repeated measures) ✅ All included ✅ One- and two-way ANOVA
PCA analysis ✅ Included ✅ Included
pI / MW calibration ✅ Included ✅ Included
Spot picking list export ✅ Included ✅ Included
Mass spectrometry data import ✅ Included ✅ Included
Image QC ✅ Included ✅ Included
21 CFR Part 11 / GMP compliance ✅ Via AuditSafe ❌ Not available
All experiment types in one licence ✅ Yes ❌ Modular — separate purchases required
Free trial ✅ Yes ✅ Yes
Direct scientific support ✅ Unlimited, included ⚠️ 2 years included with perpetual license
Active development & updates ✅ Yes ✅ Yes


Melanie feature and licensing information sourced from 2d-gel-analysis.com. Correct at time of writing — always verify current details directly with the vendor.

FAQs

Can I account for spot distortions? Yes. SameSpots uses a next-generation pixel-level image alignment algorithm that warps gel images to remove the positional variation inherent to 2D electrophoresis. This includes distortions caused by gel-to-gel variation in running conditions, differences in gel casting, and imaging artefacts. The warping process aligns all images to a shared reference, ensuring that protein spots at different positions across gels are correctly matched before any quantitative analysis is performed.

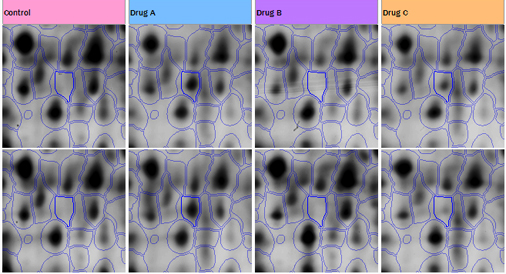
Can I compare DIGE images? Yes. SameSpots fully supports 2D-DIGE analysis for experiments using Cy2, Cy3, and Cy5 fluorescent dyes, including experiments run with a pooled internal standard. The software automatically handles all channel management, normalization, and measurement calculations after alignment and co-detection, giving you statistically robust differential expression results with no missing values across all channels. DIGE support is included in the standard SameSpots license with no additional module purchase required.

Can I match all spots across all images? Yes. SameSpots guarantees 100% spot matching with no missing values across all images in your experiment. Alignment removes positional variation between images, after which a single shared spot pattern is detected on a composite reference and automatically propagated to all images simultaneously. This means every spot is measured in every image, giving your statistical analysis a complete and unbroken dataset — a critical requirement for valid multivariate statistics in large proteomics experiments.

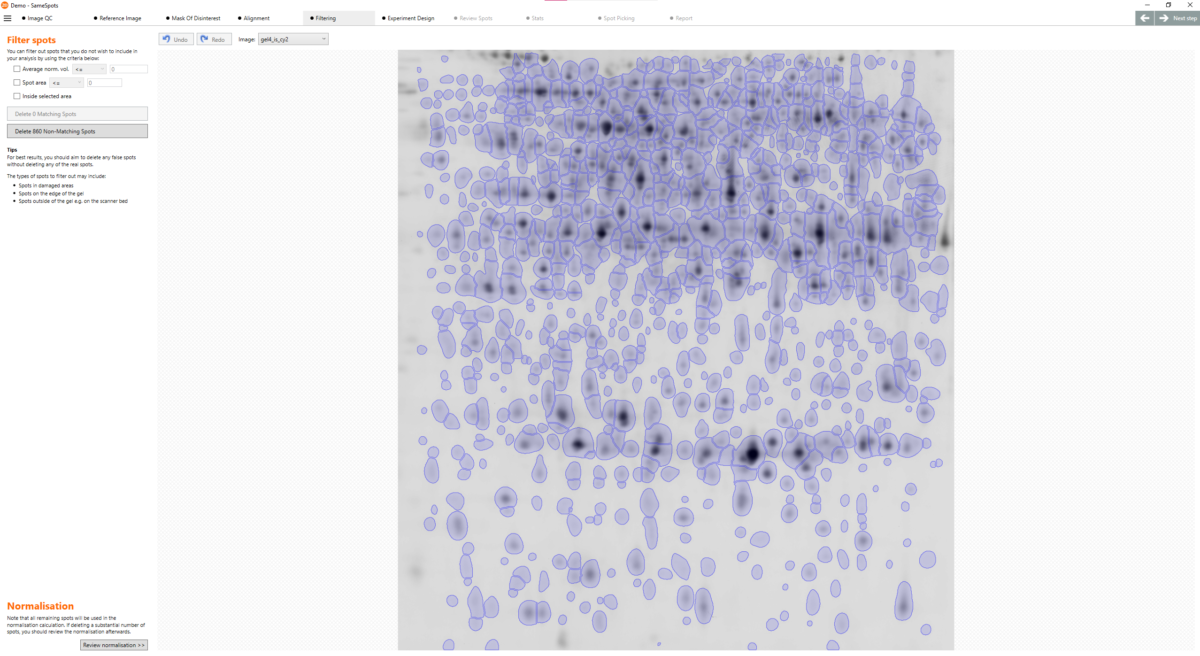
Can I highlight proteins of interest? Yes. SameSpots includes a quick-tagging system that allows you to flag protein spots showing significant changes in expression, making it easy to prioritise candidates for downstream analysis. Spots can be filtered and tagged based on statistical significance, fold change, spot abundance, or any combination of criteria. Tagged spots can then be exported directly to picking lists for mass spectrometry identification.

Can I export my results? Yes. SameSpots supports comprehensive data export at every stage of the analysis. You can export spot measurements, normalized abundances, statistical results, and analysis parameters to CSV for use in third-party software. The software also automatically generates a full PDF analysis report summarizing all QC checks, alignment results, detection parameters, statistical outputs, and images — suitable for inclusion in a LIMS, laboratory notebook, or regulatory submission.

What operating systems can I use? SameSpots is compatible with Windows 7, 8, 10, and 11. For regulated environments, SameSpots can be run in conjunction with TotalLab’s AuditSafe module to achieve full 21 CFR Part 11 and EU Annex 11 compliance on supported Windows operating systems.

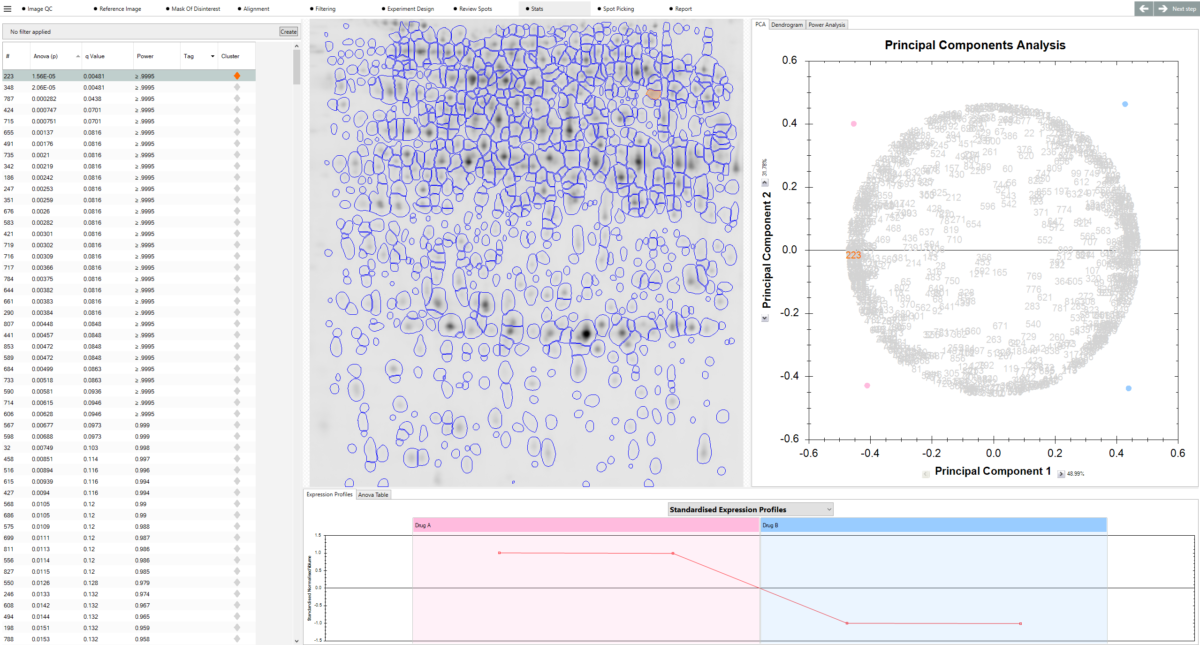
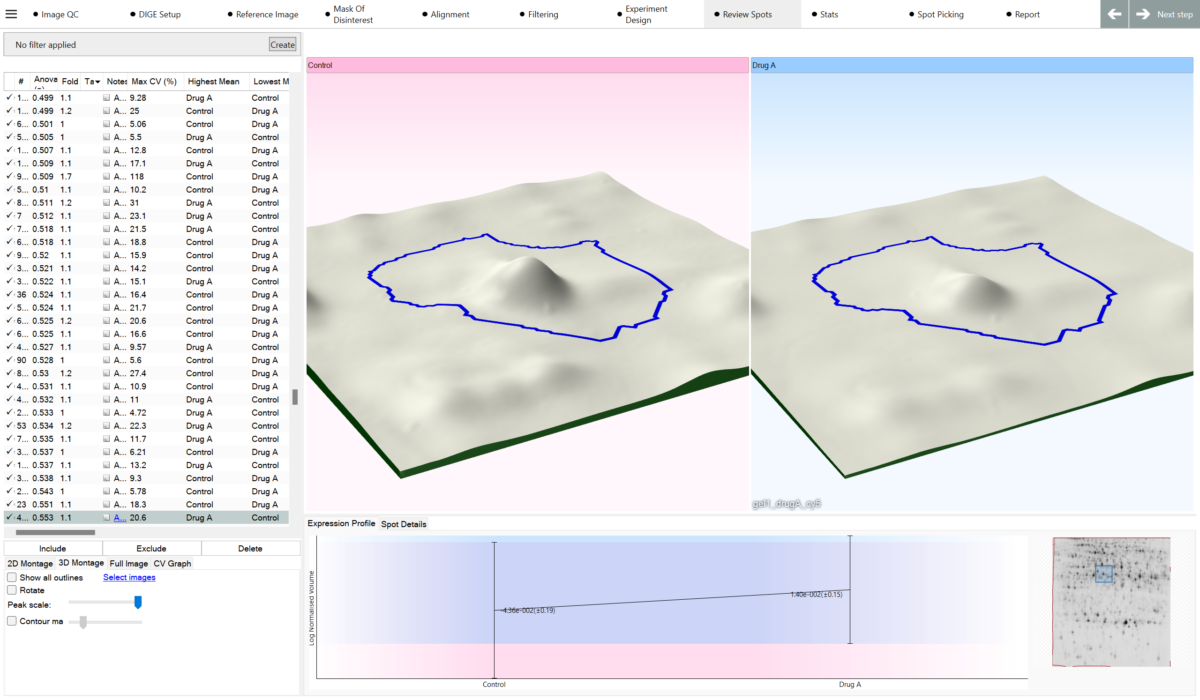
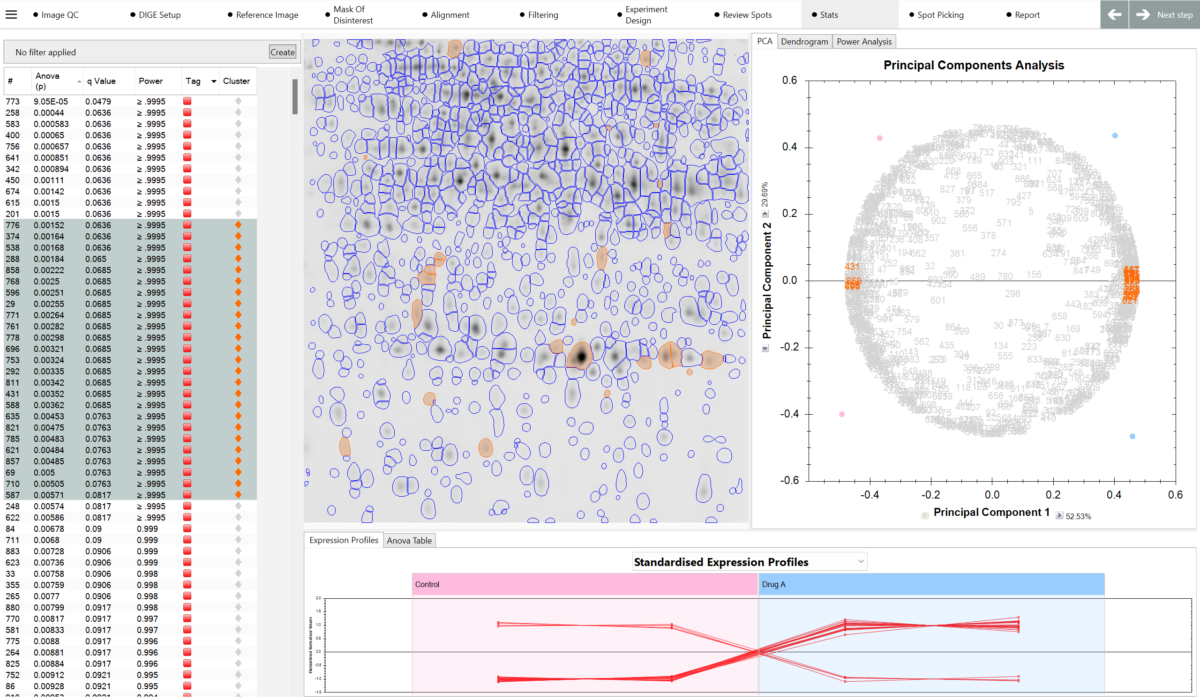
What can I use to decide which spots are interesting? SameSpots provides a full suite of analytical tools to help you identify proteins of interest, including one-way ANOVA, two-way ANOVA, repeated measures ANOVA, principal component analysis (PCA), expression profiles, interaction plots, scatter plots, and descriptive statistics including fold change, mean, standard deviation, and coefficient of variation. Statistical tests are automatically selected and configured based on your experimental design. You can combine statistical filters with abundance thresholds and manual tagging to build a shortlist of candidates with confidence.

Can I check my gel running quality? Yes. SameSpots includes image quality control tools that flag potential issues with your gel images before you invest time in analysis. Quality checks include assessment of bit-depth, image file size, saturation, and consistency of image characteristics across the dataset. Any issues are highlighted immediately upon image import, along with guidance on how to address them — helping you avoid running a full analysis on images that are unlikely to deliver reliable results.

Can I check my image quality? Yes. When adding images to the experiment they are automatically checked for quality and any issues are highlighted immediately before any further analysis is attempted. SameSpots checks for saturation, bit-depth suitability, image size consistency, and other parameters that affect the reliability of spot detection and quantification. Addressing image quality issues at this stage saves significant time compared to discovering problems after a full analysis has been run.

What checks does Image QC perform? SameSpots Image QC checks that images meet the requirements for reliable automated analysis, including: bit-depth (16-bit images are strongly recommended for quantitative analysis), saturation (overexposed spots cannot be accurately quantified), image resolution and file size consistency across the dataset, and image inversion or orientation issues. Where issues are detected, the software provides specific guidance on corrective action — for example, re-scanning at a lower sensitivity to eliminate saturated spots.

Can I edit my images? Yes. SameSpots includes image editing tools for cropping, rotating, flipping, scaling, and inverting images. Basic editing operations that are applied in the context of a DIGE experiment are automatically applied simultaneously to all images from the same gel, maintaining consistency across channels. Spot editing tools allow you to add, remove, split, merge, grow, shrink, or move spots after automated detection, with all edits propagated simultaneously across all images to maintain 100% spot matching throughout.

How can I account for different gel loading? Variation in sample loading between lanes or gels is corrected through normalization. SameSpots supports multiple normalization approaches including the default ratiometric method, total volume normalization, and spike normalization using housekeeping proteins or exogenous spike proteins. Normalization is applied before statistical analysis and is reviewed in a dedicated step in the workflow, allowing you to verify that the normalization approach is appropriate for your experimental design before proceeding to results.

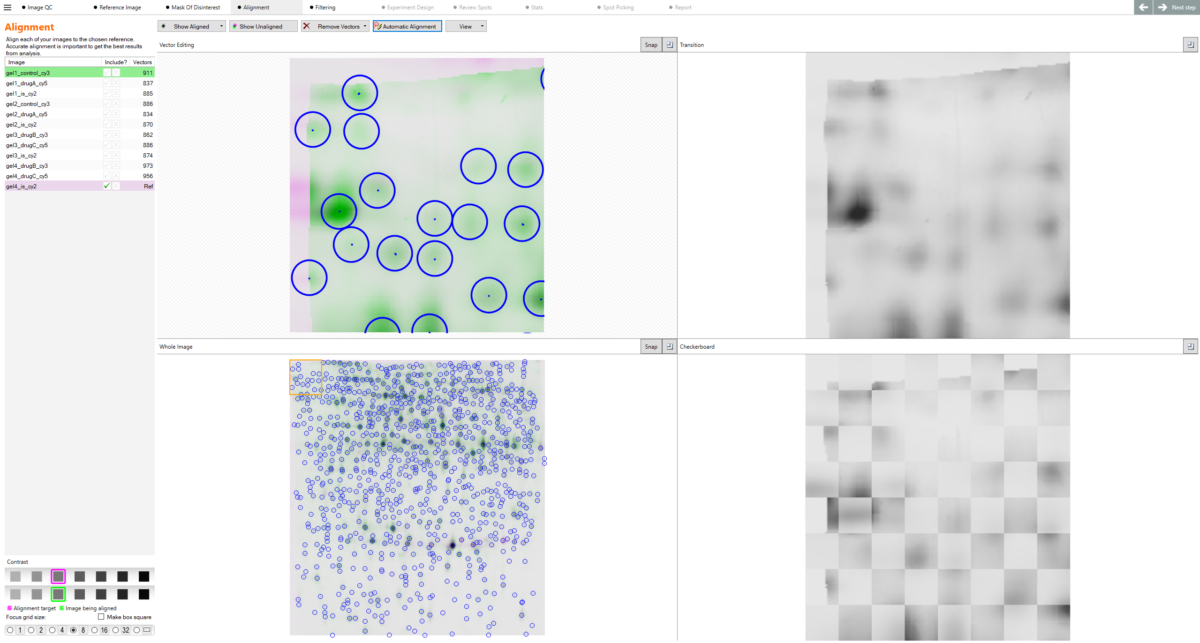
What is alignment and what problem does it solve? Alignment is the process of removing the positional variation that is inherent to 2D gel electrophoresis. Because no two gels are physically identical — even when run under identical conditions — the same protein spot will appear at a slightly different position on each gel. Without alignment, comparing spot intensities across gels would be unreliable, since you cannot be certain you are measuring the same protein in each image. SameSpots’ alignment algorithm warps each image so that all protein spots are brought into the same coordinate space, making accurate cross-gel comparison possible.

What is the reference gel? The reference gel is the image that all other images in the experiment are aligned to. SameSpots automatically selects the most suitable reference image based on image quality and spot pattern representativeness, though you can change this selection if preferred. A good reference image should have a large number of clearly resolved, representative spots. Once alignment is complete, a composite reference is generated from all aligned images, and the spot pattern is detected on this composite rather than on the reference gel alone — ensuring a more representative and complete spot map.

How does alignment work? SameSpots alignment operates by identifying corresponding spots between each image and the reference image, then warping the image so that its spots precisely superimpose with those in the reference coordinate space. This is performed automatically using TotalLab’s next-generation pixel-level alignment algorithms, which are designed to handle the full range of positional variation encountered in real experimental datasets. After automatic alignment, you can review each alignment pair using side-by-side, dual-color, or blink display modes and make manual corrections where needed using 2D and 3D editing views.

Can I calculate pI and MW? Yes. SameSpots supports pI and MW calibration by allowing you to define known pI and MW markers within your gel images. Once defined, the software calculates theoretical pI and MW values for all detected spots, which can be used to aid protein identification and to cross-reference results with mass spectrometry data or protein databases such as MASCOT.

Can I import mass spectrometry data? Yes. Protein identifications from mass spectrometry can be imported back into SameSpots from standard proteomics databases including MASCOT, as well as from custom databases. Once imported, protein identifications are displayed alongside the corresponding spot quantitation data in the analysis and are included in the exported analysis report, giving you a complete and integrated view of expression changes and protein identity in a single document.


Resources

Case Studies: SameSpots 2D Gel Analysis Software in Leading Proteomics Labs

See how SameSpots 2D gel analysis software helps leading proteomics labs cut analysis time, improve gel alignment and generate more robust biomarker data.

Read More >

Imaging 2D Gels: Essential Tips and Tricks

Discover expert insights on 2D gel electrophoresis imaging—a critical step in proteomic analysis. Learn best practices for high-resolution gel imaging, dynamic range optimization, and artifact prevention to ensure accurate, reproducible data.

Read More >

Image Capture Guide for Gel Electrophoresis Images

Good image capture is critical to guarantee optimal performance of automated image analysis packages and generate reliable scientific data. This technical document provides a brief guide to the range of different image acquisition devices currently in use for gel applications, defines some the important technical factors required to generate digital images of a quality suitable for automated image analysis and recommendations for producing good 2D gel images.

Read More >

The Essential Guide to 2D Electrophoresis

Learn how 2D electrophoresis can separate proteins by isoelectric point and molecular weight, aiding in analysis and research. Perfect for understanding complex protein mixtures and identifying biomarkers.

Read More >

How to Analyse 2D Gels

Discover the key steps of the SameSpots workflow and how it allows you to automatically analyse 2D gels with any type of staining including DIGE and DIBE.

Read More >

2D Protein Spot Excision & Identification

Learn how TotalLab's software supports accurate, contamination-free 2D protein spot excision and downstream mass spectrometry analysis. From 2D-DIGE to Western blot workflows, our tools streamline detection, quantification, and protein ID.

Read More >

2D DIGE vs 2D Gel Electrophoresis

In this short guide, we'll be explaining to you the technical process of performing 2D DIGE experiments and some of the advantages of using the technique over standard 2D electrophoresis.

Read More >

2D DIGE vs LC-MS/MS

Dive into the world of precision and versatility as we explore the distinct advantages offered by 2D DIGE and LC-MS/MS for comprehensive proteomic profiling.

Read More >

2D DIGE vs ELISA vs AAE for HCP Analysis

Explore the current landscape of anti-HCP antibody coverage with our article comparing 2D DIGE, ELISA, and AAE. Optimise your antibody selection process for robust anti-HCP analysis in biopharmaceutical research.

Read More >

What are P-values, False Discovery Rate (FDR) and q-values in Proteomics?

In this article we explore p-values, q-values and false positives and give examples of how each are calculated within our 2D proteomics analysis software, SameSpots

Read More >

PDQuest Discontinued | TotalLab Recommended by Bio-Rad

Following the discontinuation of Bio-Rad's PDQuest software, Bio-Rad now recommends TotalLab’s SameSpots and SpotMap 2D as trusted replacements for 2D gel image analysis and HCP antibody validation. Learn how these solutions offer modern workflows for differential expression and coverage scoring.

Read More >