Ion Intensity Maps for LC-MS Quality Control: SpotMap MS for Pharma
SpotMap MS software leverages a sophisticated ion intensity map visualization to empower pharmaceutical LC-MS analysts with rapid, visual quality control (QC) and sample integrity assessment. As pharmaceutical QC managers place ever-growing importance on data reliability, the robust QA tools in SpotMap MS streamline the identification and resolution of sample running problems during LC-MS analysis.
What Is an Ion Intensity Map?
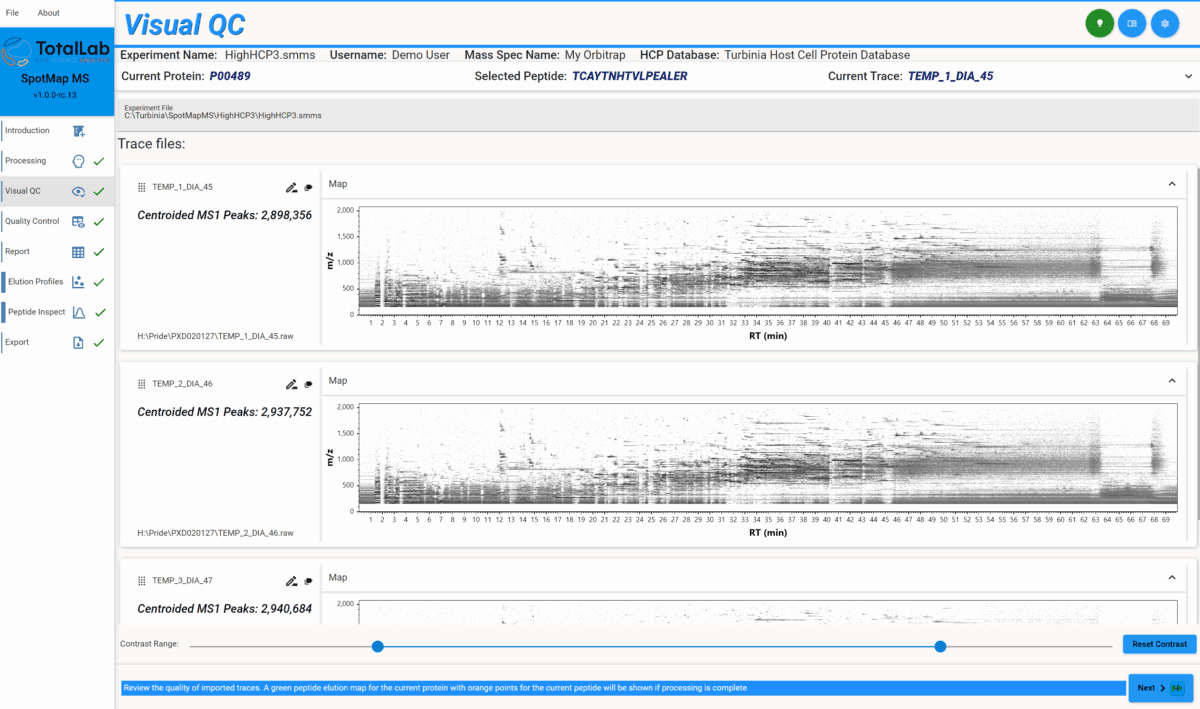
An ion intensity map (as displayed within SpotMap MS) presents LC-MS data as a two-dimensional chart with retention time increasing left-to-right and mass/charge ratio top-to-bottom, with darker regions indicating higher ion signal intensity. Users have commented this display looks similar to a 2D-PAGE representation of the data from proteomics techniques of old!
SpotMap MS uses this approach to offer users instant visual feedback of their data, enabling users to spot QC issues early that could compromise their data analysis workflow.
SpotMap MS Sample Integrity Detection
SpotMap MS displays ion intensity maps as soon as data loads, providing actionable QC guidance at the earliest possible stage. This proactive approach allows pharma scientists to avoid wasting time analyzing compromised datasets, supporting reliable, compliant results and higher laboratory efficiency. It also allows analysts to re-run their samples (if necessary) before they’ve been stored away meaning one fewer freeze-thaw cycle for precious samples.
Pharmaceutical Quality Control: Common LC-MS Challenges
SpotMap MS ion intensity maps help users diagnose several frequent LC-MS sample issues that threaten pharmaceutical data integrity:
- Sample Elution Issues: If a sample elutes over a short time window, many MS data points lack corresponding MS/MS spectra, complicating peptide identification. SpotMap MS reveals this as a compressed region on the map, helping QC teams intervene early
- Ion Spray Instability: Gaps in retention time across the ion intensity map indicate spray instability, leading to peak picking challenges and increased quantification variance. Immediate visualization in SpotMap MS allows for targeted troubleshooting. You may need to check the spray for blockages or deposits.
- Blocked Ion Spray: Large retention time gaps mean whole regions of peptide data are missing. This is a more serious case ion spray instability and SpotMap MS allows for quick identification of these events, enabling prompt hardware cleaning or column replacement before data analysis proceeds and more samples are wasted.
- LC Column Contaminants/Leaching: Vertical or diagonal streaks on the ion map reveal contamination or leaching, such as from polymers or column precipitates. SpotMap MS pinpoints these issues, supporting swift remediation to protect pharma data integrity. There are many causes of leaching, so it’s impossible to prescribe any one solution for it. A common source of contamination, however, is from polymers like polyethylene glycol (PEG), which can leach from various plastics used in sample preparation. Other problems may arise from using inappropriate running conditions for your column, failing to clean a column fully between samples, or from precipitate building up in your column frits.
- Electronic Noise: Repeating interference patterns across the map indicate hardware electrical noise, such as from loose cables. SpotMap MS helps QC teams recognize such anomalies early, maintaining instrument reliability.
Optimizing QC in Pharma LC-MS Workflows
SpotMap MS’s advanced ion intensity maps deliver trusted QC solutions tailored for pharmaceutical LC-MS professionals. By flagging integrity risks early and supporting corrective actions, SpotMap MS upholds the standards of pharmaceutical compliance, accuracy, and efficiency in high-throughput labs.
Learn More About SpotMap MS
Unlock reliable LC-MS quality control for your host cell protein pharmaceutical workflows. Contact the TotalLab team today to request a SpotMap MS demo or learn more about its QC and data integrity capabilities.