
How to Use the Hi3 Peptide Quantification Method for HCP Analysis in SpotMap MS

Overview
Learn how to apply the Hi3 label-free quantitation method inside SpotMap MS to obtain accurate, reproducible host cell protein (HCP) quantification from your LC-MS data.
What Is Hi3 Peptide Quantification?
Hi3 (High-flyer 3) is a label-free quantification method that calculates protein concentration by measuring the abundance of the three most intense peptides from each protein in your LC-MS dataset. Unlike absolute quantification methods that require protein standards, Hi3 provides rapid, accurate relative quantification of host cell proteins directly from your mass spectrometry data.
In SpotMap MS, Hi3 quantification helps to automate your workflow – from selecting the most reliable peptide spectrum matches (PSMs) to calculating final HCP concentrations. This tutorial walks you through the complete process for biopharmaceutical HCP analysis and quality control.
Why Hi3 Quantification Matters for HCP Analysis
- Label-Free Method: No isotopic labeling or expensive standards required
- Speed: Rapid quantification results from LC-MS data
- Accuracy: Uses top 3 PSMs for statistically robust measurements
- Reproducibility: Objective, algorithm-driven PSM selection
- Regulatory Ready: GMP-compliant results for FDA submissions
- Cost-Effective: Reduces reliance on external protein standards
How Hi3 Works in SpotMap MS
Step 1: Hi3 Quantitation Fundamentals for LC-MS
Hi3 quantification is based on a simple principle: protein concentration is proportional to the summed intensity of the top 3 most abundant peptides detected for that protein.
SpotMap MS automates this by:
- Identifying all peptides detected for each protein
- Ranking peptides by their peptide spectrum match (PSM) signal intensity
- Selecting the top 3 peptides with highest ionization efficiency
- Summing their intensities to calculate protein concentration
This approach eliminates bias from single peptide measurements and improves accuracy through redundancy.
Step 2: Selecting Top PSM Matches for Accurate HCP Quantitation
The quality of your Hi3 results depends entirely on PSM selection. SpotMap MS uses intelligent criteria to automatically choose the best 3 PSM matches:
- Mass Error Analysis: Only PSMs within acceptable mass accuracy ranges (typically ±10 ppm)
- Signal-to-Noise Ratio: Filters out weak, noisy detections
- Peptide Uniqueness: Prioritizes peptides specific to each protein (no cross-reactivity)
- Ionization Efficiency: Selects peptides with consistent detection across samples
- Charge State Consistency: Ensures reliable quantification across multiple charge states
Step 3: Cycling Through PSM Matches in SpotMap MS
SpotMap MS provides full transparency into PSM selection. You can manually review and adjust the top 3 PSMs for any protein:
- Open your protein in SpotMap MS peptide inspect view
- View all detected PSMs ranked by intensity
- Review mass errors and signal quality for each PSM
- Manually override selections if needed (for quality control)
- Confirm final PSM selection for Hi3 calculation
This transparency ensures regulatory compliance and allows expert review of questionable measurements.
Step 4: Analyzing Mass Errors for Quality Control
Mass error analysis is critical for validating Hi3 quantification results:
- View Mass Error: Each PSM displays its mass error in parts per million (ppm)
- Accept Threshold: SpotMap MS automatically accepts PSMs within ±10 ppm (adjustable)
- Flag Outliers: PSMs exceeding mass error thresholds are flagged for review
- Quality Metric: Mass error distribution indicates overall data quality
High mass accuracy (low error) indicates reliable peptide identification and improves confidence in quantitation results.
Step 5: Identifying Peptides Used in Hi3 Calculations
SpotMap MS clearly identifies which 3 peptides are being used for each Hi3 quantitation (however you’re free to override manually if preferred):
- Peptide Sequence: The amino acid sequence of each selected peptide
- Charge State: The ionization state(s) detected for each peptide
- Intensity Values: Peak intensity for each PSM
- Mass Error: Accuracy of mass measurement for each peptide
- Contribution to Total: Percentage of final quantification from each peptide
This level of detail is essential for:
- Regulatory documentation (FDA 21 CFR Part 11)
- Scientific publication requirements
- Troubleshooting quantification anomalies
- Method validation and documentation
Watch the workflow in SpotMap MS
See a step-by-step walk-through of Hi3 peptide quantification directly inside SpotMap MS, including PSM selection, mass error review, and report export:

Generating Host Cell Protein Quantitation Reports
 .
.Relative Quantification Workflows in Mass Spectrometry
Hi3 quantification supports multiple experimental designs:
Single-Sample Quantification
Determine absolute HCP amounts in one sample. Useful for QC screening and compliance documentation.
Multi-Sample Comparison
Compare HCP levels across multiple batches or process parameters. SpotMap MS normalizes results across samples for unbiased comparison.
Longitudinal Studies
Track HCP levels over time or across purification stages. Hi3 ensures consistency across repeated measurements.
Method Development
Optimize upstream processes by quantifying HCP reduction efficiency at each purification stage.
Key Features of SpotMap MS for Hi3 Quantification
Automated PSM Selection
SpotMap MS automatically identifies and ranks the top 3 PSMs based on signal intensity and mass accuracy—eliminating manual, error-prone selection.
Mass Error Quality Control
Real-time mass error analysis with customizable thresholds ensures only high-quality PSMs are used in quantification calculations.
Transparent Peptide Tracking
Full visibility into which peptides are being used for Hi3 calculations—critical for regulatory compliance and method validation.
GMP-Compliant Reporting
Automatic generation of audit trails, electronic signatures, and compliant reports meeting FDA 21 CFR Part 11 requirements.
Multi-Sample Batch Processing
Process dozens of samples simultaneously with consistent Hi3 calculations across entire batches.
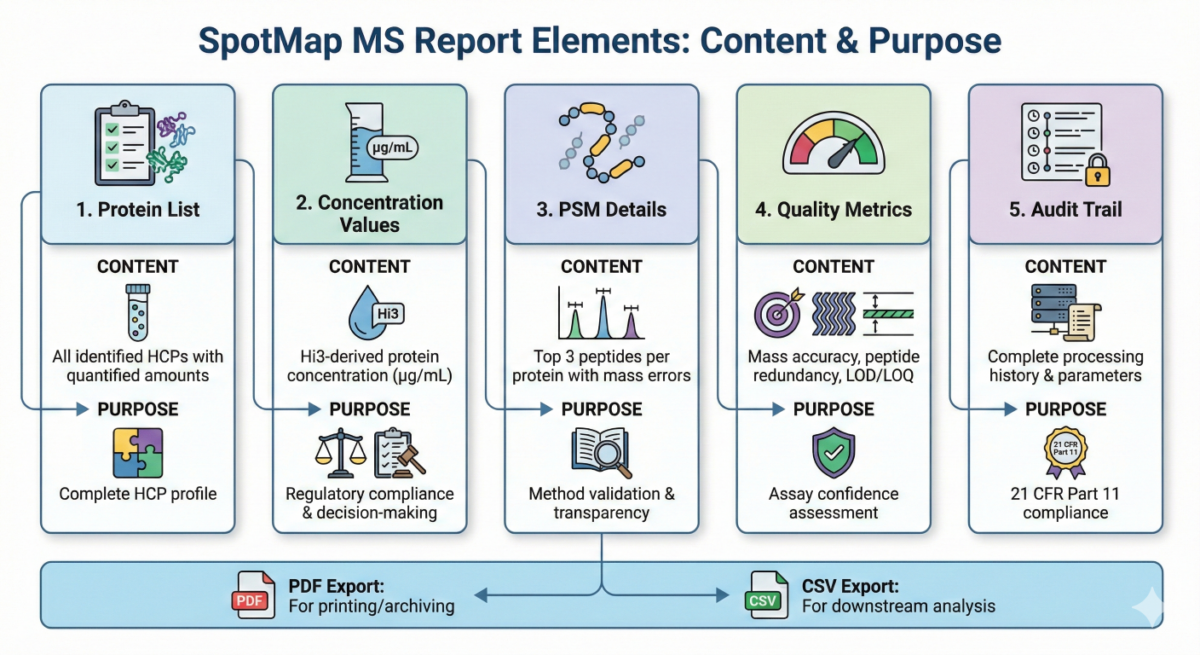
Export Flexibility
Export quantification results as PDF reports or CSV data for integration with LIMS and downstream analysis software.
Best Practices for Hi3 Quantification
- Quality Control First: Always review mass error distributions before finalizing quantification results
- Peptide Validation: Confirm selected peptides are truly protein-specific (no cross-reactivity)
- Standard Inclusion: Include positive/negative control samples in every batch
- Documentation: Export detailed reports including all PSM data for regulatory files
- Method Validation: Document Hi3 method parameters (mass error threshold, LOD/LOQ) in your SOP
- Consistency: Use identical Hi3 settings across all related studies for comparability
Use Cases & Applications
- Biopharmaceutical QC Testing: Rapidly quantify HCPs in final drug substance to confirm removal efficiency and compliance with regulatory limits (typically <100 ppm for biotherapeutics)
- Process Development Optimization: Compare HCP levels across different purification methods and process parameters to optimize HCP removal while maintaining yield
- Regulatory Compliance: Generate FDA-compliant quantitation reports documenting HCP control throughout manufacturing
- Bioprocessing Research: Quantify protein expression levels and purification efficiency in cell culture and bioprocessing workflows
- Academic Research: Support peer-reviewed publications with transparent, reproducible protein quantification methodology
Frequently Asked Questions
What is the difference between Hi3 and iBAQ quantification?
Hi3 uses the top 3 peptides for quantification, while intensity-Based Absolute Quantification (iBAQ) uses all detected peptides for a protein. Hi3 is more stringent and preferred when fewer, high-quality peptides are detected.
Do I need protein standards for Hi3 quantification?
No. Hi3 is a label-free method that doesn’t require expensive protein standards. However, spike-in controls are recommended for method validation.
Can Hi3 quantification be used for absolute protein amounts?
Hi3 provides relative quantification (fold-changes between samples) by default. Absolute quantification requires protein standards or external calibration curves.
How do I validate Hi3 method performance?
Validate by: (1) comparing to orthogonal quantification methods, (2) assessing mass accuracy and peptide redundancy, (3) testing LOD/LOQ, and (4) analyzing batch reproducibility.
Is Hi3 quantification compliant with FDA 21 CFR Part 11?
Yes. SpotMap MS generates automatic audit trails, electronic signatures, and detailed reports meeting all FDA compliance requirements.
What mass error tolerance should I use for Hi3?
Standard tolerance is ±10 ppm for high-resolution mass spectrometers. Adjust based on your instrument’s calibration and data quality.
Get Started with Hi3 Quantification in SpotMap MS
Start your free trial of SpotMap MS and experience automated, accurate Hi3 peptide quantification for your HCP analysis workflows. Our team provides full technical support and personalized demos for pharmaceutical QC, biotech R&D and regulatory teams.
Try SpotMap MS Free Today
Experience how SpotMap MS transforms your HCP analysis workflow. Our team provides full technical support and personalized demos for pharmaceutical QC, biotech R&D and regulatory teams.