Automatic 1D Gel Electrophoresis and Western Blot Analysis Software

Click Here For Your Free Trial!

Introducing Phoretix 1D

Over the past twenty years TotalLab has been at the forefront of 1D gel electrophoresis and Western Blot analysis software producing such legacy products as TotalLab Quant, GelQuant, TL100, TL120, TotalLab 1D and CLIQS.

Phoretix 1D is the latest evolution of our 1D Gel and Blot analysis software and has been developed in line with industry needs and feedback to deliver the highest-quality data in the shortest amount of time.

We have distilled our decades of experience supporting the life science industry in 1D analysis into Phoretix 1D to deliver our most advanced set of analysis tools yet, capable of analyzing images derived from any Gel Documentation, densitometer or other imaging devices in record time.

Phoretix 1D is the complete solution for analyzing gel electrophoresis and immunoblot images, it offers:

  • Speed. Automate your entire analysis and get results in less than a minute per image.
  • Objectivity. Unmatched automation reduces the need for manual intervention and minimizes inter-operator variability.
  • Reproducibility. Consistent analysis results between different users, labs and different imaging devices.
  • Quantitation. Enables reliable, accurate quantitation of gel and blot images.
  • Compliance. When combined with our AuditSafe software, allows users to meet and even exceed FDA 21 CFR part 11, EudraLex Annex 11, GAMP5 or more general GxP standards/ALCOA principles for compliance within regulated or QC/QA environments, from captured image all the way through to final analysis and report production.

Phoretix 1D is compatible with the latest versions of both Windows (currently Windows 11) and macOS operating systems (up to and including Ventura and M1/M2/M3 processors).

Our Phoretix 1D software is is trusted by the world’s leading educational, industrial and pharmaceutical companies:

"After having used many other software for gel image analysis, including Bio-Rad's Image Lab and ImageJ, I started using Phoretix 1D out of necessity in a new role. I found it to be much more intuitive and streamlined than what I’ve used in the past. Background subtraction, band picking, and band analysis are all automated with optional manual adjustment if desired"

Garry Smith, Proliant Health and Biologicals

Analyse a Huge Variety of Image Based Experiments

Phoretix 1D is the perfect choice for the quantitative, automated analysis of:

  • DNA/RNA Gels
  • Western Blots
  • Northern Blots
  • Southern Blots
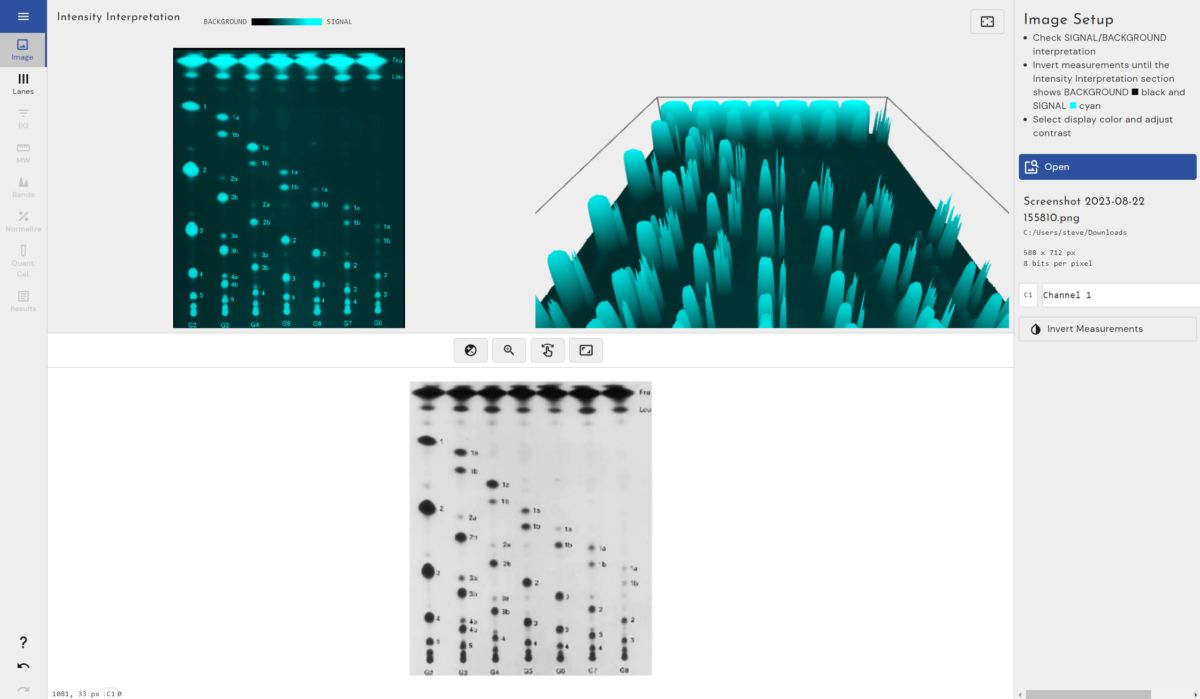
  • Thin-layer chromatography
  • Lateral flow tests (LFT/LFA)
  • Checkerboard DNA-DNA hybridization

It also allows you to overcome the limitations present in other 1D analysis software, supporting extremely high-definition images over 200mb in size and multiplexed images to make sure the quality of your experiments isn’t limited by your choice of analysis software.

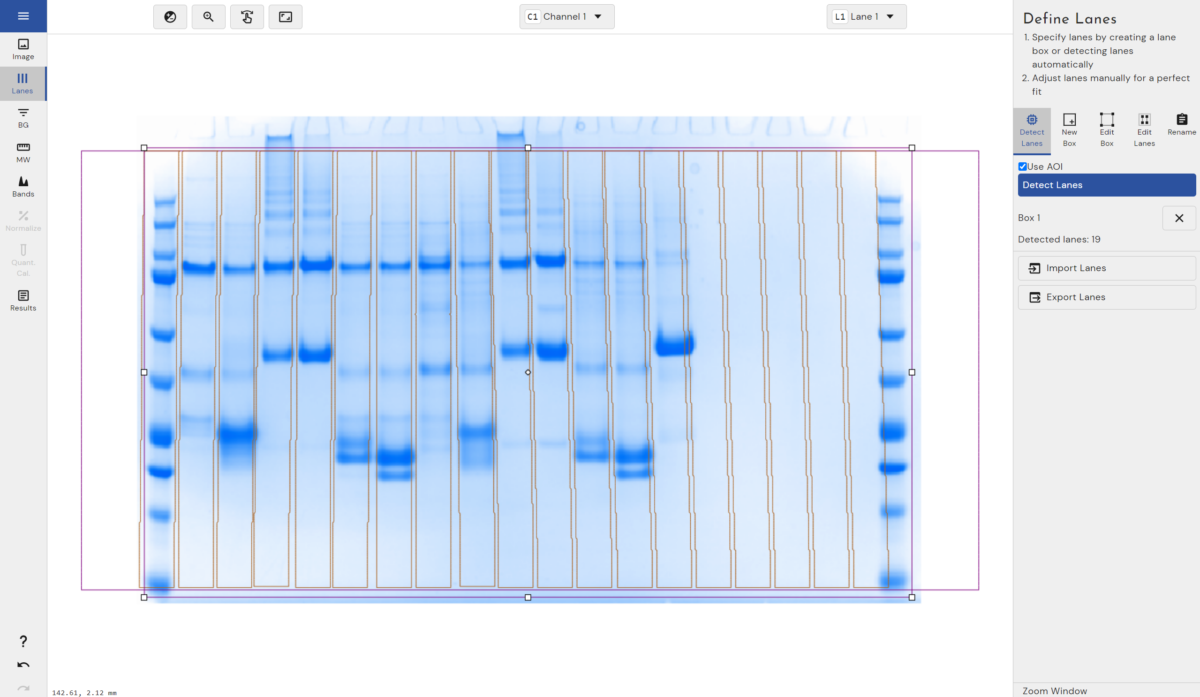
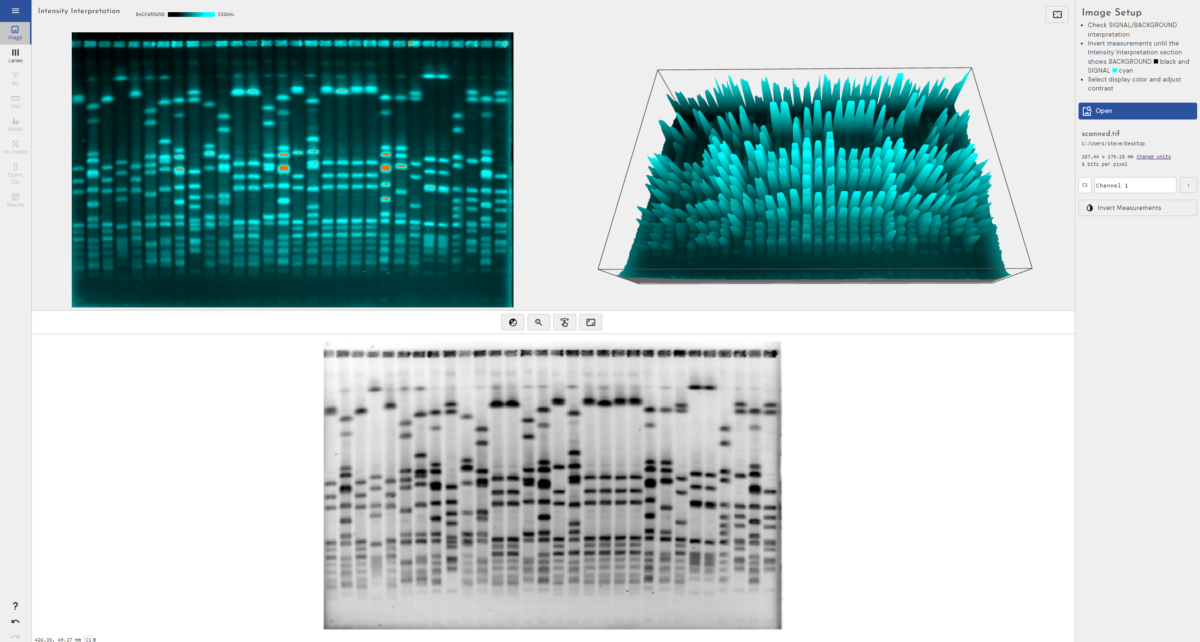
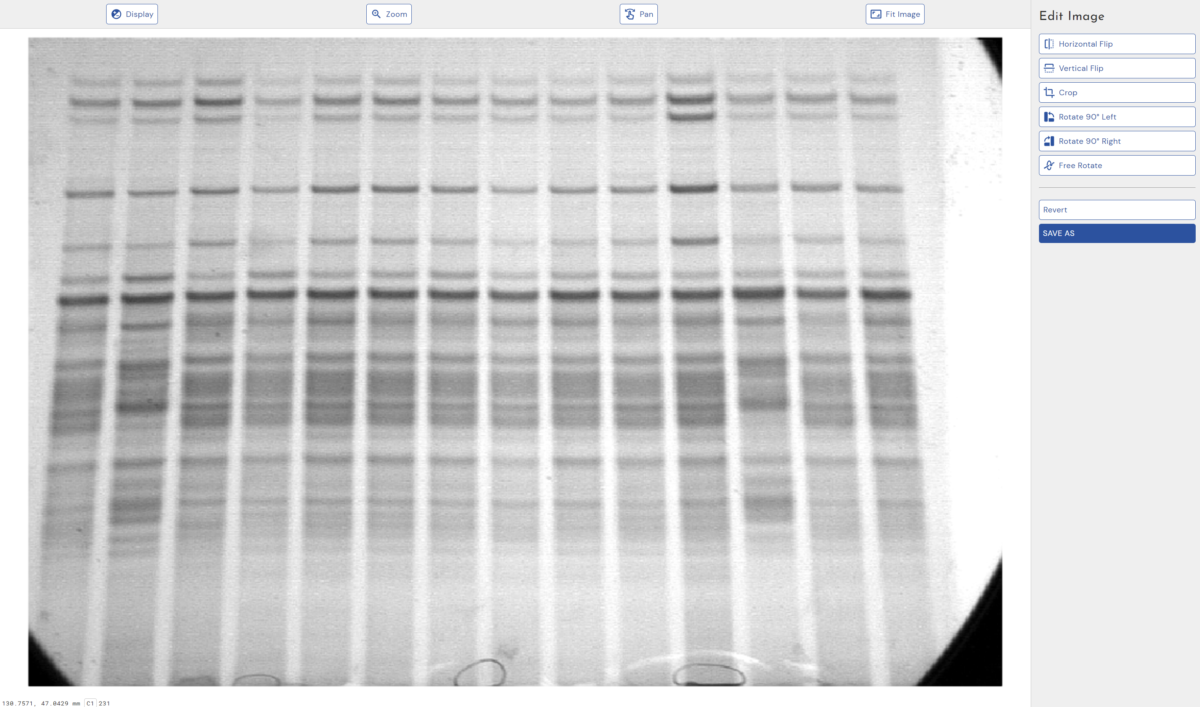
western blot example
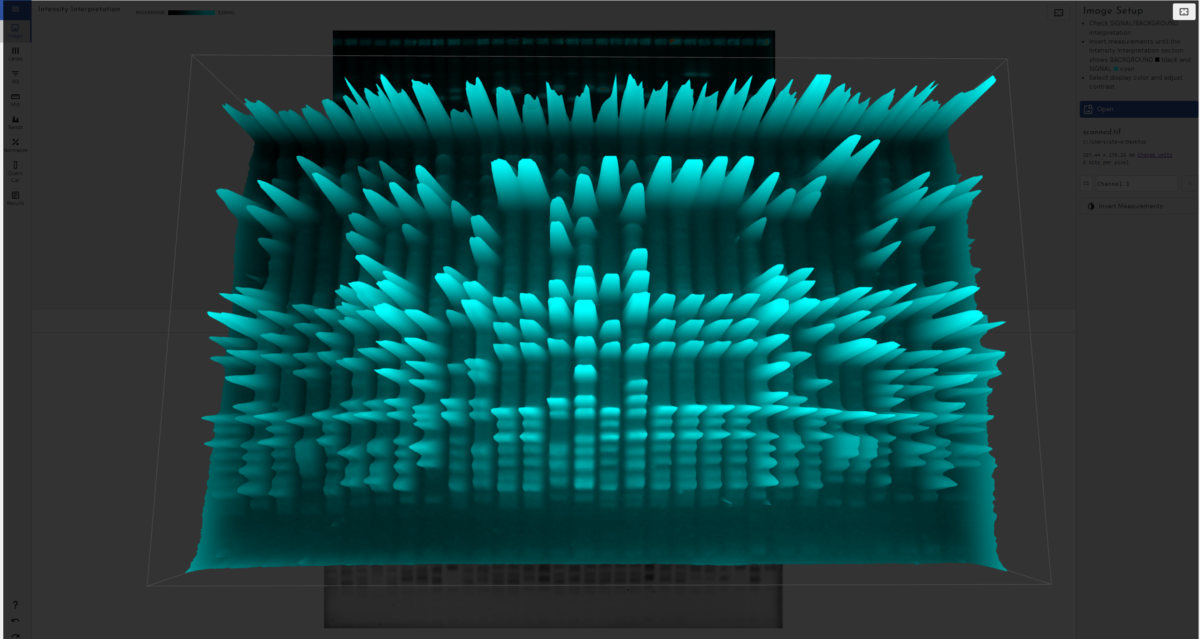
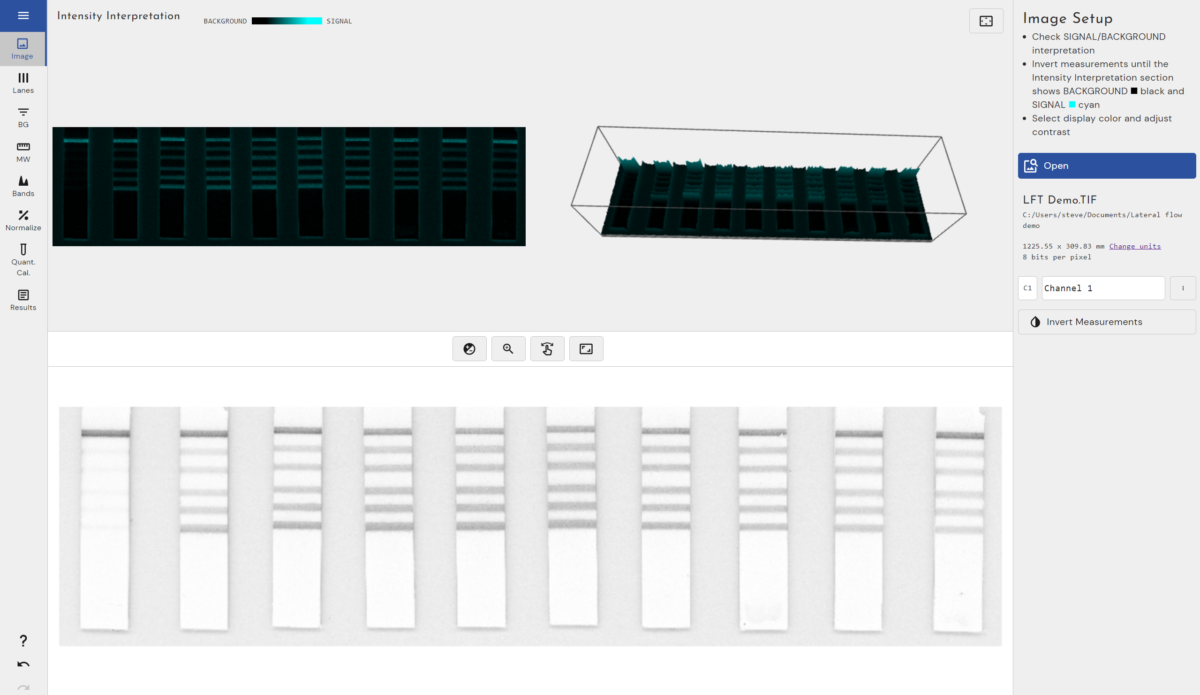
3D view of electrophoresis gel
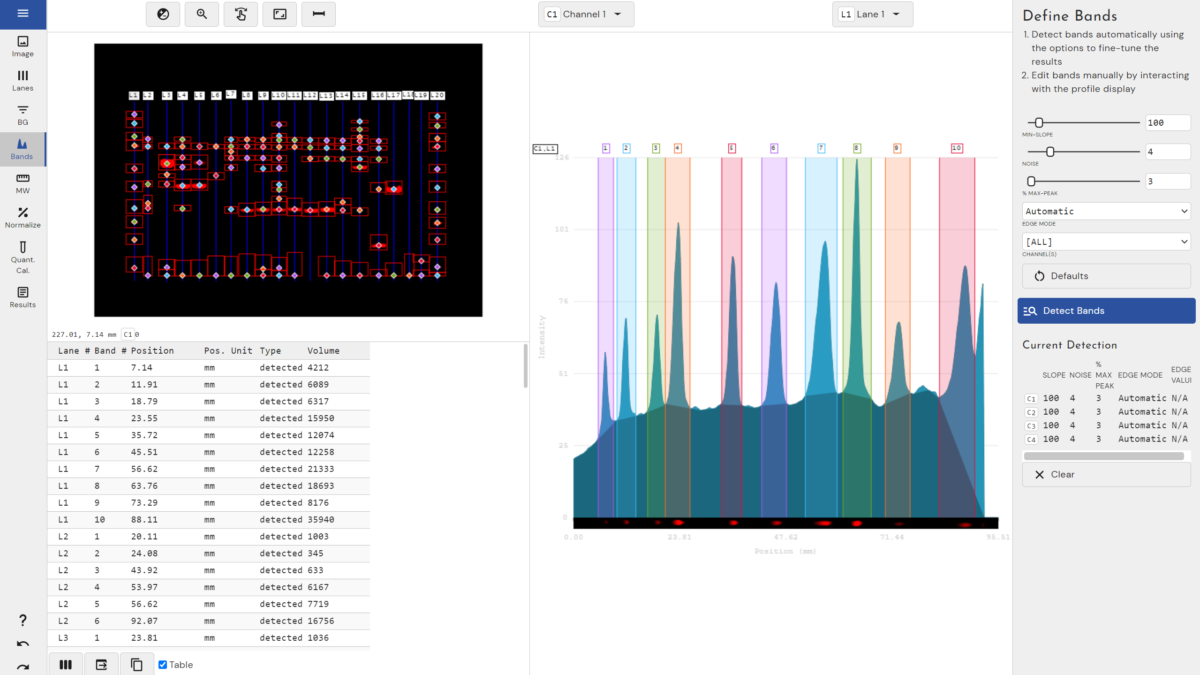
automatic band detection mode for Western Blot and electrophoresis gels

"Phoretix 1D allows for the fast and accurate analysis of immunoblots, supported by optimal control over quantification parameters allowing for the generation of highly reproducible data. All features are embedded within a user-friendly interface, I especially liked the background analysis features which assists in an unbiased analysis by correcting for irregular background signals."

Jacqueline Kaiser, The University of Melbourne

One-Click Quantification and Collaboration

Phoretix 1D offers users incredibly customizable 1-click automatic analysis of 1D SDS-PAGE and Western Blot images. Whilst you’re working on your analysis, Phoretix 1D intelligently captures your analysis settings and allows you to save them as a template file to be used again on your next experiment. When it’s time to analyze your next gel or blot simply load the previous template and go straight to your results with no need for manual intervention, saving users a huge amount of manual labor and, importantly, time.

A user can build up an unlimited library of templates to cover all their routine analyses and then share them easily sent with colleagues or even other sites anywhere in the world via something as easy as an email attachment to ensure they’re all running exactly the same analysis settings. This removes the potential for operator error entirely, greatly reduces inter-operator variability therefore reducing risk, harmonizing multiple global production or research sites and for tech transfer to a CDMO/CMO.

automatic western blot analysis

Advanced Background Removal and Noise Correction Algorithms

Background noise can come from various sources, such as non-specific binding of antibodies or stains, uneven illumination, dust, scratches, or instrumentation artifacts. If not corrected, background noise can affect the intensity and shape of the bands or spots, leading to inaccurate measurements of their size, quantity, and relative expression. Therefore, it is important to perform background removal to subtract the unwanted signal from the image, before quantifying bands or spots to make sure your data is as accurate as possible.

Our Phoretix 1D software features multiple methods of background removal for our users to choose from and refine their analysis:


AdaptiveUser-Defined
  • Rolling Ball
  • Lane Edge
  • Rubber Band
  • None
  • Constant Value
  • Image Rectangle
  • Profile Minimum
  • Fully manual

We also support the ability to choose different background removal techniques and settings on a per-lane basis (invaluable for accurate analysis of lanes with varying background levels between them) and different background removal techniques and settings on a per-channel basis if using multichannel images. This allows the user to compensate for different background levels between different antibodies or stains used on the same gel or blot and allows for accurate quantification and total protein normalisation functions.

Phoretix 1D also features innovative noise-reduction techniques to smooth out the intensity signal of your bands or spots, resulting in cleaner data for analysis.

You can find out more about our background removal options here or watch the video below.

Built-in Image Editor

Didn’t capture your gel or blot image perfectly? Not a problem.

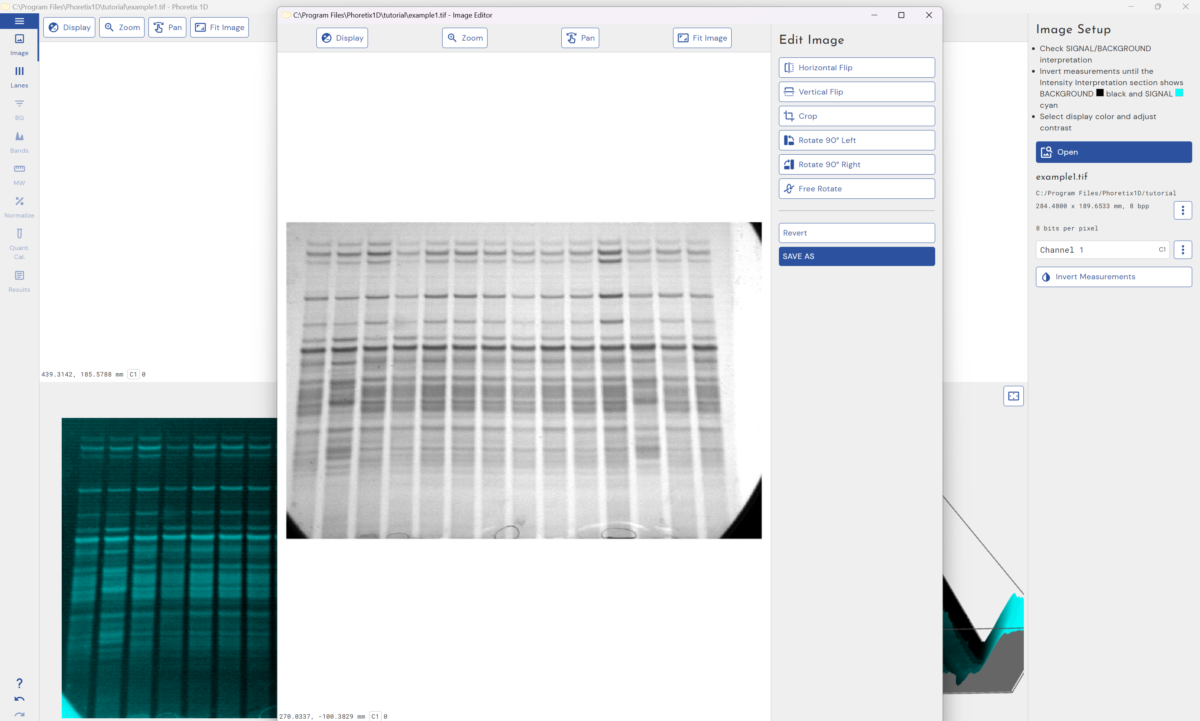
Whilst the automatic lane and band detection algorithms built into Phoretix 1D are optimized to allow users to obtain high-quality data from less than high-quality images (meaning less repeated experiments) we appreciate that some users like the ability to edit an image before analysis to rotate it or crop out any areas of stage around the gel or blot.

Phoretix 1D supports all these functions and also includes the ability to flip gels or blots vertically or horizontally. Editing the image within Phoretix 1D means that the original .TIFF tags containing image metadata are preserved which is not the case in other image editing software, this means you can keep information relating to scale, bit depth, DPI etc. intact.

western blot example

Harmonise your lab equipment

Our software is device agnostic, so can reduce costs as it can be used with all of your existing laboratory equipment regardless of the manufacturer or any additional equipment gained during future business acquisitions.

Phoretix 1D is compatible with (but not limited to) gel documentation equipment produced by Bio-Rad, Cytiva, Azure Biosystems, Thermo Fisher Scientific, Syngene, Vilber and Pop-Bio.

It’s also compatible with all industry-standard image formats:

.TIF/.TIFF

Phoretix 1D supports 8-bit, 16-bit (recommended) and higher uncompressed TIFF images. Multi-page and multiplex TIFFs are supported and each page is interpreted as a “channel” (all of which must have the same dimensions and pixel format).

.JPG/.JPEG/.PNG/.BMP/.IMG

While not recommended because of their low bit-depth and (sometimes) compression artifacts, these image formats can still be analyzed.

This means you aren’t locked in or reliant on one particular equipment manufacturer, reducing your business risk, allowing you greater freedom in your imaging equipment selection and facilitating easier tech transfer between labs.

Flexible Licensing Made Easy

Here at TotalLab we’ve been working with pharmaceutical customers for decades and we know that some of our users prefer using air-gapped computers to enhance security within their sites. This isn’t a problem, all TotalLab software can be activated easily either online or offline.

Our licensing system licenses a whole computer at once, with no restrictions on the number of users who have access to the software on that computer.

Licenses can be purchased singularly for one computer or we also offer discounts on multiple license purchases at the same time if you want to cover multiple computers across your site; enabling hybrid working to perform analysis outside of the lab or to allow multiple analyses to happen at the same time.

We can also support enterprise licensing for full site-wide licenses covering large pharmaceutical manufacturing facilities and research facilities at a significant discount vs buying singular or multiple licenses.

For pricing and any other licensing related queries please contact us.

21 CFR Part 11 and GMP/GxP compliance

Phoretix 1D, along with all TotalLab software, can be integrated into our 21 CFR Part 11/GMP-compliant AuditSafe software to generate a full audit trail with electronic signatures during analysis for use in regulated industry environments where data traceability, accountability, and integrity are critical.

AuditSafe restricts software and data access through secure user sign-ins, granular permissions, audit logs, electronic signatures and image authenticity checks. Click here to find out more.

How to Purchase

The best way to ensure you’re purchasing the latest version of Phoretix 1D with the highest level of technical support is directly from us here at TotalLab by using the contact us form. We can accept payment in GBP (£), USD ($) or EUR (€).

We do appreciate that some of our customers prefer sourcing products locally in a local currency or prefer to deal in their native language which may not be English. To facilitate this, TotalLab work with a global network of authorized distributors which you can find here.

Supporting our customers

Here at TotalLab, we are a mixture of PhD-educated life scientists, mathematicians and software developers with decades of experience and we take pride in offering the highest level of support and educational resources to all of our customers. Our team of experts are dedicated to ensuring that you have the best experience possible with our software and we fully comprehend the scientific principles behind both your images and experiments.

We never use call centers – when you need support, be it through email or phone, you’ll speak directly to a member of the TotalLab team responsible for the development of our software. We understand your time is valuable, which is why we aim to resolve your queries as quickly as possible, ensuring minimal disruption to your workflow.

In addition to our exceptional support, we also offer a range of educational resources to help you make the most of our software. Our extensive library of tutorials and guides will provide you with the knowledge you need to use our software to its fullest potential. Whether you are a seasoned professional or a newcomer to our software, our resources will ensure that you have the skills you need to succeed.

You can access our video tutorials here:

Aftersales support

When you purchase from TotalLab, not only do you get access to our industry-leading advanced image analysis software but you also benefit from unlimited technical support, training and free updates to the latest version of your software on release.

If you have a question about using our software, please check our FAQ or Resources. Alternatively, you can email support@totallab.com and a member of our team will be in touch to help you.

FAQs

Can I install on a machine with no internet connection?

Yes you can. It is called a manual installation and if there is no internet connection on registration then you just follow the instructions to get a license working. If you plan to use the machine offline then make sure it is unplugged on registration.

What Operating Systems can I use?

Phoretix 1D is compatible with Windows Vista, Windows 7, Windows 8,Windows 10 and Windows 11, both 32 and 64 bit versions. It's also compatible with both Intel and M1/M2 and M3 CPU based Macs up to macOS Sequoia

Why does Automatic Lane Creation fail on my gel?

There could be several reasons why this happens. It could be because

The lanes are short or have very few bands

The lanes are too close together so the algorithm cannot split them

The lanes are not quite the same width which is an assumption the algorithm uses

The resolution of the image is very low and there is not enough band information

Using an AOI for lane detection can help (just draw a box when in automatic detection mode) or simply try to create the lanes manually.

How does Molecular Sizing work?

Each lane has its own calibration curve calculated from where the iso-molecular weight lines (grey) cross the centre of a lane. With only one standard lane these curves are usually the same as the lines just run horizontally across the gel. However with more than one standard lane it joins up the bands of the same value and so the lines can be slightly off horizontal depending on the gel. This allows our molecular sizing algorithm to accurately calculate MW even with gels that haven't perfectly horizontally (as is the case with "smiley" or "frowny" gels).

Why use different curve fit types?

The default curve fit is cubic spline. This curve type creates a smooth curve passing through all points. It has no defining equation. This option can be somewhat over sensitive to inaccurate mappings but will guarantee that the results are as expected from where the iso-molecular weight lines(yellow) cross the lanes. First order Lagrange is similar but uses straight lines.


The other main option used historically is the Linear Log equation which is a straight line calculated from the log of the Molecular Size. This is theoretically correct but can lead to misleading results due to any inaccuracy of the curve fit. Even curves with high R2 results can still have problems.

What is the name of the curve fitting algorithm?

We use an iterative algorithm called Levenberg-Marquardt to get the results for the curve fitting equations. Cubic Spline and First order Lagrange are also well defined algorithms.

My image does not look like the image I captured. Why?

A histogram of all pixel values is created. Then the default auto contrast is created from the value of the histogram after 0.5% of all pixels and at 99.5% of all pixels. This stops outliers or scanner noise affecting the result but it can look a little different.


If the image has calibration or an encoding (from Cytiva or Fujitsu scanners) then the converted values are used by default for the image.


Note: Contrast does not affect the values used in any calculations, these are always taken from the raw image data stored at the file level.

My profile is upside down. What can I do to fix it?

Using the "invert measurements" button within the first stage of the workflow you can invert the image to restore your profile.

What file formats can the software support?

The software can load in .tif, .tiff, .jpg,.jpeg, .png, .gif, .gel, .img (Fuji), .bmp files.

When I load in my JPG file the image is inverted.

This occasionally happens as part of the loading function. Just press the invert button on the toolbar to see if reversed again.

What is Band Volume?

This is defined as the total value of all the pixels in a band with background subtracted. The pixels are shown on the image as between the 2 red lines (the band edges). Another way to look at it is as the area under the profile for the band (with background subtracted) multiplied by the lane width.

Where can you get the total volume of all the bands in a Lane?

In the results section of the workflow in the "Lane Information" section.

Resources

Image Capture Guide for Gel Electrophoresis Images

Good image capture is critical to guarantee optimal performance of automated image analysis packages and generate reliable scientific data. This technical document provides a brief guide to the range of different image acquisition devices currently in use for gel applications, defines some the important technical factors required to generate digital images of a quality suitable for automated image analysis and recommendations for producing good 2D gel images.

Read More >

How to Read Western Blot

Learn how to read Western blot results with easy, actionable steps. From sample preparation to data analysis, TotalLab's guide covers everything you need for accurate protein detection. Perfect for researchers and lab professionals!

Read More >

Phoretix 1D | Background Removal Techniques For Western Blot

In this demo, we explain the difference between our background removal techniques and how to choose the correct one based on your data.

Read More >

Phoretix 1D | How to Automate Your Western Blot or Gel Electrophoresis Analys

The automatic analysis features built into Phoretix 1D can save you huge amounts of time in a high-throughput environment and minimise inter-operator and inter-lab variability.

Read More >

Western Blot Troubleshooting Guide

The best methods for troubleshooting Western blots, including solutions for common issues like no signal, high background, non-specific bands, and uneven bands. Improve your Western blotting results with our detailed guide and visual aids

Read More >

Get in touch to trial Phoretix 1D >