
How to read a western blot: what each band is telling you
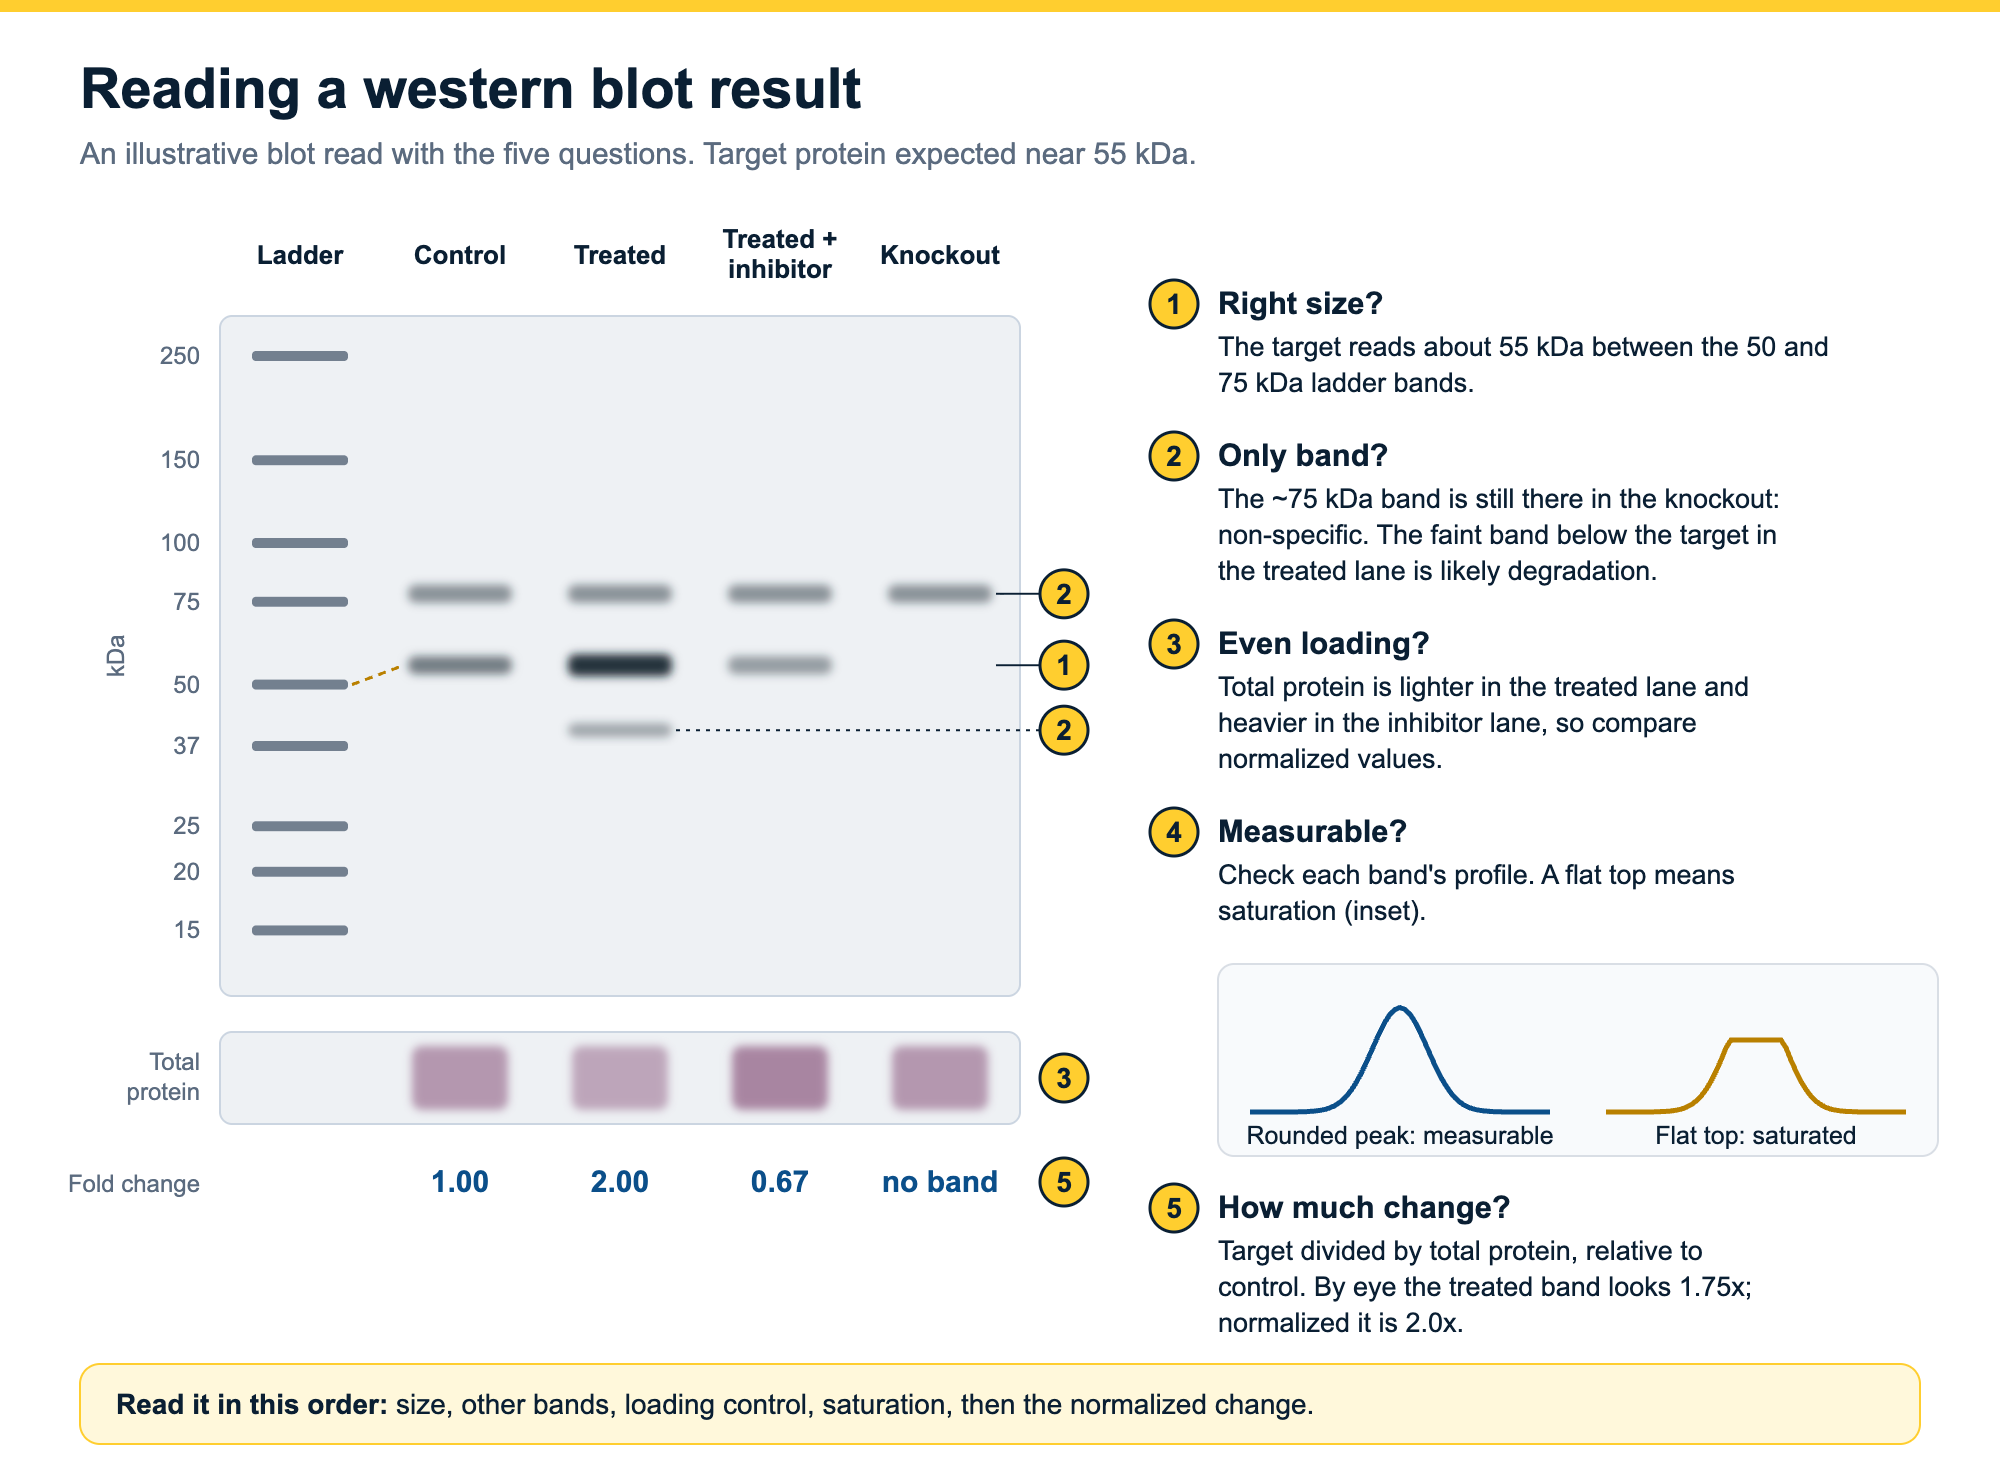
To read a western blot, start with the ladder: find your band and check that it sits near the size you expect. Then look for other bands in the same lane and decide what they are. Check the loading control to see whether every lane received the same amount of protein. Make sure the band you care about is not saturated. Only then compare lanes, and compare them as numbers normalized to the loading control, not by how bright they look.
This guide takes each of those steps in turn, with an annotated example blot and a worked calculation. A western blot tells you three things: whether a protein is there, its apparent size, and how its amount compares between samples. Each of those readings has a trap, and most of the traps are visible in the image if you know where to look.
On this page
- Reading a western blot in five questions
- What a western blot tells you, and what it does not
- Lanes, ladder and bands: reading the layout
- Is it the right protein? Reading band size
- More than one band: what extra bands mean
- Did every lane get the same amount? The loading control
- Reading band intensity: brighter is not always more
- Comparing lanes: from “looks stronger” to a fold change
- How to present western blot results
- Get band values from your blot with Phoretix 1D
- Frequently asked questions
Reading a western blot in five questions
| Question | Where to look | What a good blot shows | If it does not |
|---|---|---|---|
| Is it the right protein? | Your band against the ladder lane | A band near the expected size that the antibody supplier also reports | Modifications, acidic or membrane proteins and gel chemistry shift bands; confirm with positive and negative controls |
| Is it the only band? | The rest of the same lane | One band, or extra bands you can explain | Isoforms, modified forms, degradation (below), dimers (above) or non-specific binding; a knockout or knockdown lane tells them apart |
| Did every lane get the same amount? | The loading control: housekeeping band or total protein stain | Even loading control in every lane | Normalize each band to its own lane's loading control before comparing |
| Can the band be measured? | The band core and the background around it | Peaks with a rounded top, no white or flat centers, background low and even | Saturated or burnt-out bands cannot be measured; re-image at a shorter exposure or load less protein |
| How much did it change? | Normalized band values across lanes and replicates | A fold change from at least three biological replicates | Comparing bands by eye mixes loading differences into the result; quantify by densitometry and normalize |
The five questions to ask of every western blot, where in the image to find the answer, and what to check when the answer is not what you expected.
What a western blot tells you, and what it does not
A western blot separates the proteins in a sample by size on a gel, transfers them to a membrane, and detects one target with an antibody (ref 1). The method came from Harry Towbin’s laboratory in 1979, and W. Neal Burnette gave it the name “western blotting” in 1981 (refs 2, 3). Read correctly, a blot tells you whether your target protein is present, roughly how large it is, and how its amount compares between your samples.
It does not tell you how many nanograms of protein are in a lane. Western blot data are usually described as semi-quantitative: they give a relative comparison between samples rather than an absolute amount (refs 1, 4). Two things stand in the way of absolute numbers. Loading and transfer vary from lane to lane, and the detected signal is not linear across the whole range of protein amounts (ref 1). Absolute quantification is possible, but it needs a linear standard curve of purified target protein, and it is rarely done (ref 4).
Size alone does not prove identity either. Many proteins run at a different position from their predicted molecular weight, and an unrelated protein can run at exactly the size you expect (ref 4). The antibody’s specificity, shown with positive and negative controls, is what tells you the band is your protein.
If you only need to know whether a protein is present, or how much of it there is, across many samples, a dot blot skips the gel and the transfer. The dot blot protocol explains when that is enough and when you still need a western blot.
Lanes, ladder and bands: reading the layout
Each vertical lane is one sample. Proteins enter at the wells at the top and move down toward the positive electrode, so large proteins stay near the top and small proteins run furthest. One lane, usually at an edge, holds the molecular weight marker or ladder: a set of proteins of known size that you read your bands against.
A band is the antibody signal from one protein species. On a chemiluminescent or fluorescent image the bands are usually dark on a light background, or bright on a dark one, depending on how the imager displays the image. The loading control is often a second strip of the same membrane, or a second channel of the same image, showing a protein or total protein stain that should be equal in every lane.
Before you read anything else, check that the lanes and ladder are labeled, that the image is the right way up, and that nothing is cropped between the ladder and your band. A blot you cannot orient cannot be read.
Is it the right protein? Reading band size
Read the size of your band against the ladder. Find the two ladder bands either side of it and estimate where your band falls between them. Because proteins migrate roughly in proportion to the logarithm of their molecular weight, sizes are not evenly spaced down the gel: the distance from 100 to 50 kDa is about the same as the distance from 50 to 25 kDa. For a reported value, plot each ladder band’s migration distance against the log of its molecular weight and read your band off the curve.
Expect some difference from the predicted size, and know where it comes from:
- Post-translational modifications. Glycosylation, phosphorylation, ubiquitination and other modifications add mass and change how a protein runs (ref 4).
- Acidic proteins. Proteins rich in glutamate and aspartate often run larger than predicted (ref 4). One zebrafish protein ran about 13 kDa above its predicted size, and the shift tracked the share of acidic amino acids (ref 5).
- Membrane proteins. They bind SDS differently from soluble proteins. In one study, membrane protein fragments ran between 10% faster and 30% slower than their formula weights would predict (ref 6).
- Gel and buffer. The same protein can run at different positions on different gel chemistries. Calsequestrin 1 has a predicted mass of about 45 kDa but runs near 63 kDa on a Tris-HCl gel (ref 4).
- Incomplete denaturation. A band at roughly twice the expected size can be a dimer or complex that survived sample preparation; reheating the sample can break it up (ref 1).
So a band 5 or 10 kDa from the predicted size is not automatically wrong, and a band at exactly the right size is not automatically right. Check the antibody supplier’s data for the size they observe, and run a positive and a negative control (ref 4).
Smiling or bowed gels make sizing harder, because the ladder at one edge no longer lines up with bands in the middle. Running a ladder at both edges gives you two anchor points to read between. The troubleshooting guide covers how to rescue a smiling gel.
More than one band: what extra bands mean
One antibody can give several bands, and not all of them are a problem. The usual explanations are:
- Isoforms and splice variants. Several forms of the protein share the epitope and run at different sizes (ref 4).
- Modified forms. Phosphorylated, glycosylated or otherwise modified forms of the same protein can run as separate bands at slightly different sizes (ref 4).
- Degradation. Bands below the expected size can come from proteolysis during sample preparation. Fresh samples kept cold with protease inhibitors reduce them (ref 1).
- Dimers and complexes. Bands well above the expected size can be multimers that were not fully denatured (ref 1).
- Non-specific binding. The antibody recognizes a different protein. Many commercial antibodies do this to some degree (ref 4).
Controls separate these. A lysate that overexpresses the target, or purified protein, shows which band is yours; a knockout or knockdown sample shows which bands remain when the target is gone (ref 4). An extra band does not stop you quantifying the target, provided it is far enough away in the lane that the two do not overlap (ref 4). If they do overlap, the measurement of your band includes some of the other one.
If extra bands, smears or patches are the problem rather than the question, the western blot troubleshooting guide is organized by what the problem looks like.
Did every lane get the same amount? The loading control
Before comparing your target between lanes, check that the lanes are comparable. Loading and transfer are never exactly equal, so every quantitative blot needs a loading control: a measurement in each lane that should be constant across your samples (refs 1, 4).
There are two kinds. A housekeeping protein, such as beta-actin, GAPDH or tubulin, is detected with its own antibody. A total protein stain, such as Ponceau S, Coomassie or a stain-free gel, measures everything in the lane (ref 4).
Read the loading control critically. Housekeeping proteins are abundant, so they often saturate when you load enough protein to see a weak target. Their levels can also change with the experiment, for example under hypoxia, serum starvation or exercise, or with the density of cultured cells (ref 4). Total protein normalization does not depend on one protein’s expression, and it has become more widely used for that reason (ref 4). Our total protein normalization guide compares the stains.
If the loading control bands differ visibly between lanes, do not compare the target by eye. Normalize first.
Reading band intensity: brighter is not always more
A darker or brighter band usually means more protein, but only inside the linear range, where the signal rises in step with the amount of protein. Outside it, the image compresses the differences. In one published example, a protein that increased 23-fold measured only a 4-fold increase once ten times as much sample was loaded (ref 4). The band was still visible. It just no longer reported the real change.
Saturation is the extreme case. A saturated band has reached the maximum value the detector or film can record. You can spot it in the image as a band with a flat, uniform core or a white center, sometimes called a ghost or burnt-out band; white bands on film come from too much protein or antibody (ref 1). In a lane profile, a saturated band has a flat top instead of a peak. Digital imagers have about three times the linear dynamic range of film and make saturation easier to detect (ref 4), so image at the longest exposure that leaves your strongest band unsaturated, and keep the raw file.
Background matters too. A band sitting on a bright haze looks stronger than it is, and how you subtract that background changes the number. The western blot densitometry guide explains saturation, the linear range and background subtraction in detail.
Even with a good image, reading intensity by hand is where results drift. In a study of quantitative western blotting cited by Ghosh and colleagues, differences between operators accounted for nearly 80% of the total variance (ref 4).
How to capture an image that stays inside the linear range, and which edits journals allow, is covered in western blot and SDS-PAGE images.
Comparing lanes: from “looks stronger” to a fold change
To compare your target between samples, turn each band into a number, divide it by the loading control in the same lane, then express each lane relative to your control sample. The worked example below shows why the order matters.
| Lane | Sample | Target band volume | Loading control volume | Normalized (target / control) | Fold change vs control |
|---|---|---|---|---|---|
| 1 | Control | 12,000 | 40,000 | 0.30 | 1.00 |
| 2 | Treated | 21,000 | 35,000 | 0.60 | 2.00 |
| 3 | Treated + inhibitor | 9,000 | 45,000 | 0.20 | 0.67 |
Illustrative numbers. Band volumes are background-subtracted densitometry values from the same blot; the loading control is a total protein stain in the same lanes.
By eye, the treated band in lane 2 is 1.75 times brighter than the control (21,000 against 12,000). But lane 2 also received less protein: its loading control is 35,000 against 40,000. Normalized, the increase is 2.0-fold. Lane 3 goes the other way: it looks 25% weaker, but it was loaded more heavily, and the normalized value is a third lower than the control.
One blot is one experiment. Run at least three biological replicates, take the normalized fold change from each, and report the mean with its spread and the statistical test you used. How to quantify a western blot, step by step, covers the full workflow from image to replicates, and the western blot normalization calculator does the arithmetic.
How to present western blot results
A reader should be able to check your reading from the figure and the methods. Show the ladder or mark molecular weights beside the bands, label every lane, and show the loading control from the same membrane. If you crop, crop to show the bands with some space around them, and keep the uncropped image: journals increasingly ask for the raw image files behind a blot (ref 7).
In the methods, say how much protein you loaded and how you measured it, which antibodies you used (supplier, catalog number, lot and dilution), the membrane and transfer method, the imager and exposure, and the software used to quantify the bands (ref 4). State the normalization, the number of replicates and the statistics.
If you quantified with Phoretix 1D, the methods sentence reads: “Band intensities were quantified by densitometry using Phoretix 1D (TotalLab Ltd, Newcastle upon Tyne, UK) with rolling-ball background subtraction, and normalized to total lane protein [or: to a housekeeping band].” Swap the bracketed part for the normalization and background method you used.
Reading a blot with Phoretix 1D
Reading a blot by eye gets you “brighter” and “fainter”. Phoretix 1D turns the same image into numbers you can report:
- Lanes and bands are detected automatically, including lanes that lean or bow, and you can correct any lane or band by hand.
- Molecular weights come from your ladder: pick it from the built-in library of commercial ladders or add your own, choose the curve fit, and every band is sized.
- Saturated pixels are shown in color, so you know before you report a number whether the band can be measured.
- Background is subtracted with one of eight methods, set per lane.
- Bands are normalized to a reference band, a housekeeping channel or total lane volume.
- The analysis goes into a PDF report, with every setting recorded.
It reads images from any gel or blot imager (8-bit and 16-bit TIFF, JPEG, PNG, BMP and IMG, plus Bio-Rad .scn files) on Windows, macOS and Linux, and returns results in under a minute per image (ref 8).
The video below sizes every band on a gel against its ladder: lanes detected and corrected on a frowning gel, Rf measured, and molecular weights assigned with the curve fit of your choice.

Read your next blot as numbers
Open a blot in a free Phoretix 1D trial and get lanes, band sizes and normalized values in under a minute per image, with a PDF report of every setting.
Frequently asked questions
Q: What does a western blot tell you?
A: Whether a specific protein is present in a sample, its apparent molecular weight, and how its amount compares between samples. The comparison is relative, so western blot results are usually described as semi-quantitative. Absolute amounts need a standard curve of purified target protein.
Q: How do you read the bands on a western blot?
A: Each vertical lane is one sample, and the ladder lane gives the sizes. Find your band, read its size against the ladder bands either side of it, check for other bands in the lane, then check that the loading control is even across lanes. Compare band intensity only after normalizing each band to its loading control.
Q: Why is my western blot band at a different size than expected?
A: Post-translational modifications, a high content of acidic amino acids, detergent binding by membrane proteins, the gel and buffer system, and dimers that were not fully denatured can all shift a band away from its predicted size. Check the size the antibody supplier observes and run positive and negative controls.
Q: What do multiple bands on a western blot mean?
A: They can be isoforms or splice variants, modified forms of the protein, degradation products (below the expected size), dimers or complexes (above it), or non-specific binding by the antibody. A positive control and a knockout or knockdown sample show which band is your target.
Q: What is a loading control in a western blot?
A: A measurement in each lane that should be the same in every sample, used to correct for differences in loading and transfer. It is either a housekeeping protein such as beta-actin, GAPDH or tubulin, or a total protein stain such as Ponceau S or a stain-free gel. Total protein is increasingly preferred because housekeeping proteins often saturate and can change with the experiment.
Q: Is a western blot quantitative?
A: Semi-quantitative. It compares the amount of a protein between samples reliably when the bands are inside the linear range, unsaturated, background-subtracted and normalized to a loading control, with replicates. It does not give absolute amounts without a standard curve.
Q: How long does a western blot take?
A: Usually about two days. A typical protocol runs the gel for about an hour, transfers for about 90 minutes and blocks for an hour, then incubates the primary antibody overnight at 4 °C. The secondary antibody, washes and detection take a few more hours the next day.
References
- Mahmood T, Yang PC. Western blot: technique, theory, and trouble shooting. N Am J Med Sci. 2012;4(9):429-34. doi:10.4103/1947-2714.100998
(Source for: western blot steps; semi-quantitative because of lane-to-lane loading and transfer variation and non-linear signal; degradation giving unexpected bands; reheating to break up high-running complexes; white bands from too much protein or antibody; protocol timings: gel about 1 hour, transfer 90 minutes, blocking 1 hour, primary antibody overnight at 4 °C, secondary 1 hour.) - Towbin H, Staehelin T, Gordon J. Electrophoretic transfer of proteins from polyacrylamide gels to nitrocellulose sheets: procedure and some applications. Proc Natl Acad Sci U S A. 1979;76(9):4350-4. doi:10.1073/pnas.76.9.4350
(Source for: origin of the method, 1979.) - Burnette WN. “Western blotting”: electrophoretic transfer of proteins from sodium dodecyl sulfate–polyacrylamide gels to unmodified nitrocellulose and radiographic detection with antibody and radioiodinated protein A. Anal Biochem. 1981;112(2):195-203. doi:10.1016/0003-2697(81)90281-5
(Source for: the name “western blotting”, 1981.) - Ghosh R, Gilda JE, Gomes AV. The necessity of and strategies for improving confidence in the accuracy of western blots. Expert Rev Proteomics. 2014;11(5):549-60. doi:10.1586/14789450.2014.939635
(Source for: semi-quantitative use and absolute quantification needing a standard curve; size alone not proof of specificity; anomalous migration and calsequestrin 1 example; multiple bands from modification or splicing; non-specific commercial antibodies; positive and negative controls; quantifying a target despite a distant non-specific band; housekeeping proteins overloaded and variable; total protein normalization; Bag3 23-fold vs 4-fold linear range example; digital imagers about three times the linear dynamic range of film; interoperator variability nearly 80% of total variance; details to report in methods.) - Guan Y, Zhu Q, Huang D, Zhao S, Jan Lo L, Peng J. An equation to estimate the difference between theoretically predicted and SDS PAGE-displayed molecular weights for an acidic peptide. Sci Rep. 2015;5:13370. doi:10.1038/srep13370
(Source for: acidic protein running about 13 kDa above its predicted size.) - Rath A, Glibowicka M, Nadeau VG, Chen G, Deber CM. Detergent binding explains anomalous SDS-PAGE migration of membrane proteins. Proc Natl Acad Sci U S A. 2009;106(6):1760-5. doi:10.1073/pnas.0813167106
(Source for: membrane protein fragments running -10% to +30% against formula weight.) - Taylor SC, Berkelman T, Yadav G, Hammond M. A defined methodology for reliable quantification of Western blot data. Mol Biotechnol. 2013;55(3):217-26. doi:10.1007/s12033-013-9672-6
(Source for: journals requesting raw image files.) - TotalLab. Phoretix 1D product page and tutorial videos, including “SDS-PAGE Rf Value & Molecular Weight Calculation” (hIxDZHnP9o8).
(Source for: automatic lane and band detection including uneven lanes; ladder library and custom ladders; curve fits; saturation display; eight background methods; normalization modes; PDF report; file formats including .scn; Windows, macOS and Linux; under a minute per image; how-to-cite sentence.)