
How to calculate western blot normalization, with worked examples

Western blot normalization corrects the intensity of your target band for the amount of protein that actually reached each lane, so that a difference between lanes reflects biology rather than pipetting, loading or transfer. Normalization is one step in western blot quantification, after band detection and background subtraction. There are two ways to do it. Total protein normalization divides the target by all the protein in the lane, measured from a stain-free gel or a stained membrane. Housekeeping protein normalization divides it by a single reference band such as beta-actin, GAPDH or tubulin. This guide explains both, works through the calculation for each with real numbers, shows the case where the two methods disagree and why, and ends with a template for reporting the method. A calculator is included if you would rather not do the arithmetic by hand.
Phoretix 1D quantifies the target and the loading control with one background method, normalizes to a housekeeping band or total lane protein, flags saturated bands in its 3D view, and reports the ratio to control with a PDF and CSV. Free trial, any imager, Windows, macOS and Linux.
On this page
- What normalization corrects
- Total protein normalization
- Housekeeping protein normalization
- The calculation, step by step
- The total protein version
- Normalization calculator
- Housekeeping versus total protein
- Five mistakes that break normalization
- Reporting normalization in your methods
- Frequently asked questions

What western blot normalization corrects, and what it does not
Every lane on a blot receives a slightly different amount of protein. Pipetting error, protein assay error, uneven transfer from gel to membrane and uneven antibody access across the membrane all change how much signal a lane can produce before any biology is involved. Normalization measures a loading control in the same lane as the target, a signal that should be the same in every lane if loading were perfect, and divides the target by it. If lane two received 4% more protein than lane one, its loading control will be 4% brighter, and dividing by it removes the 4% from the target as well.
Normalization does not correct for saturation, for a target outside the linear range of detection, or for differences between separate blots run on different days with different exposures. Those have to be handled before the calculation: the densitometry guide covers saturation and the linear range in detail, and comparisons should be made within a blot, with a common sample on each blot if you must compare across them.
Total protein normalization
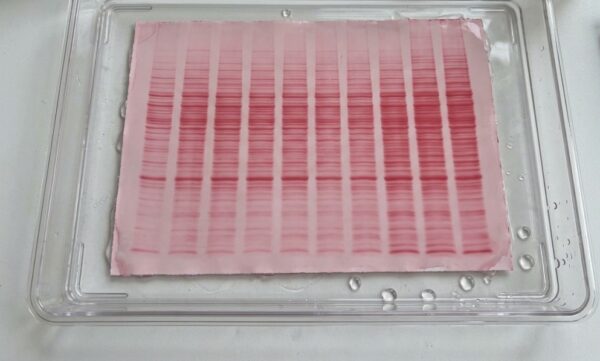
Total protein normalization (TPN) uses the entire protein content of each lane as the loading control. The lane is stained after transfer with a reversible membrane stain such as Ponceau S or a fluorescent stain such as REVERT or SYPRO Ruby, or the gel itself is imaged before transfer using stain-free chemistry, which makes tryptophan-containing proteins fluoresce under UV. The whole lane is quantified as one value, the total lane volume, and the target band is divided by it.
Its strength is that it integrates over hundreds of proteins, so no single protein changing with your treatment can distort it, and the summed signal has a much wider linear range than any one band. That is why journals and reagent manufacturers now recommend it for quantitative blots, and why it is the method searchers most often ask about. Its requirements are a stain or a stain-free gel and an imager that can capture it, and a stained image that is itself in the linear range: a heavily loaded lane can saturate a total-protein image just as a housekeeping band can. Quantify the stain image at an exposure with no saturated pixels, using the same lane boundaries and the same background method as the target. For which stain to use, what the published comparisons found and how to capture a valid total protein image, see the total protein normalization guide.
Housekeeping protein normalization: beta-actin, GAPDH and tubulin
Housekeeping protein normalization divides the target by the band of a protein assumed to be expressed at a constant level in every sample. Beta-actin is the most common choice by a wide margin, then GAPDH and alpha- or beta-tubulin, occasionally vinculin, HSP90 or lamin B1 depending on the compartment. It is what most published methods still describe: in our analysis of papers citing TotalLab software, beta-actin is named in about one in six, with GAPDH and tubulin behind it. It needs only a second antibody and works on any blot, which is why it persists.
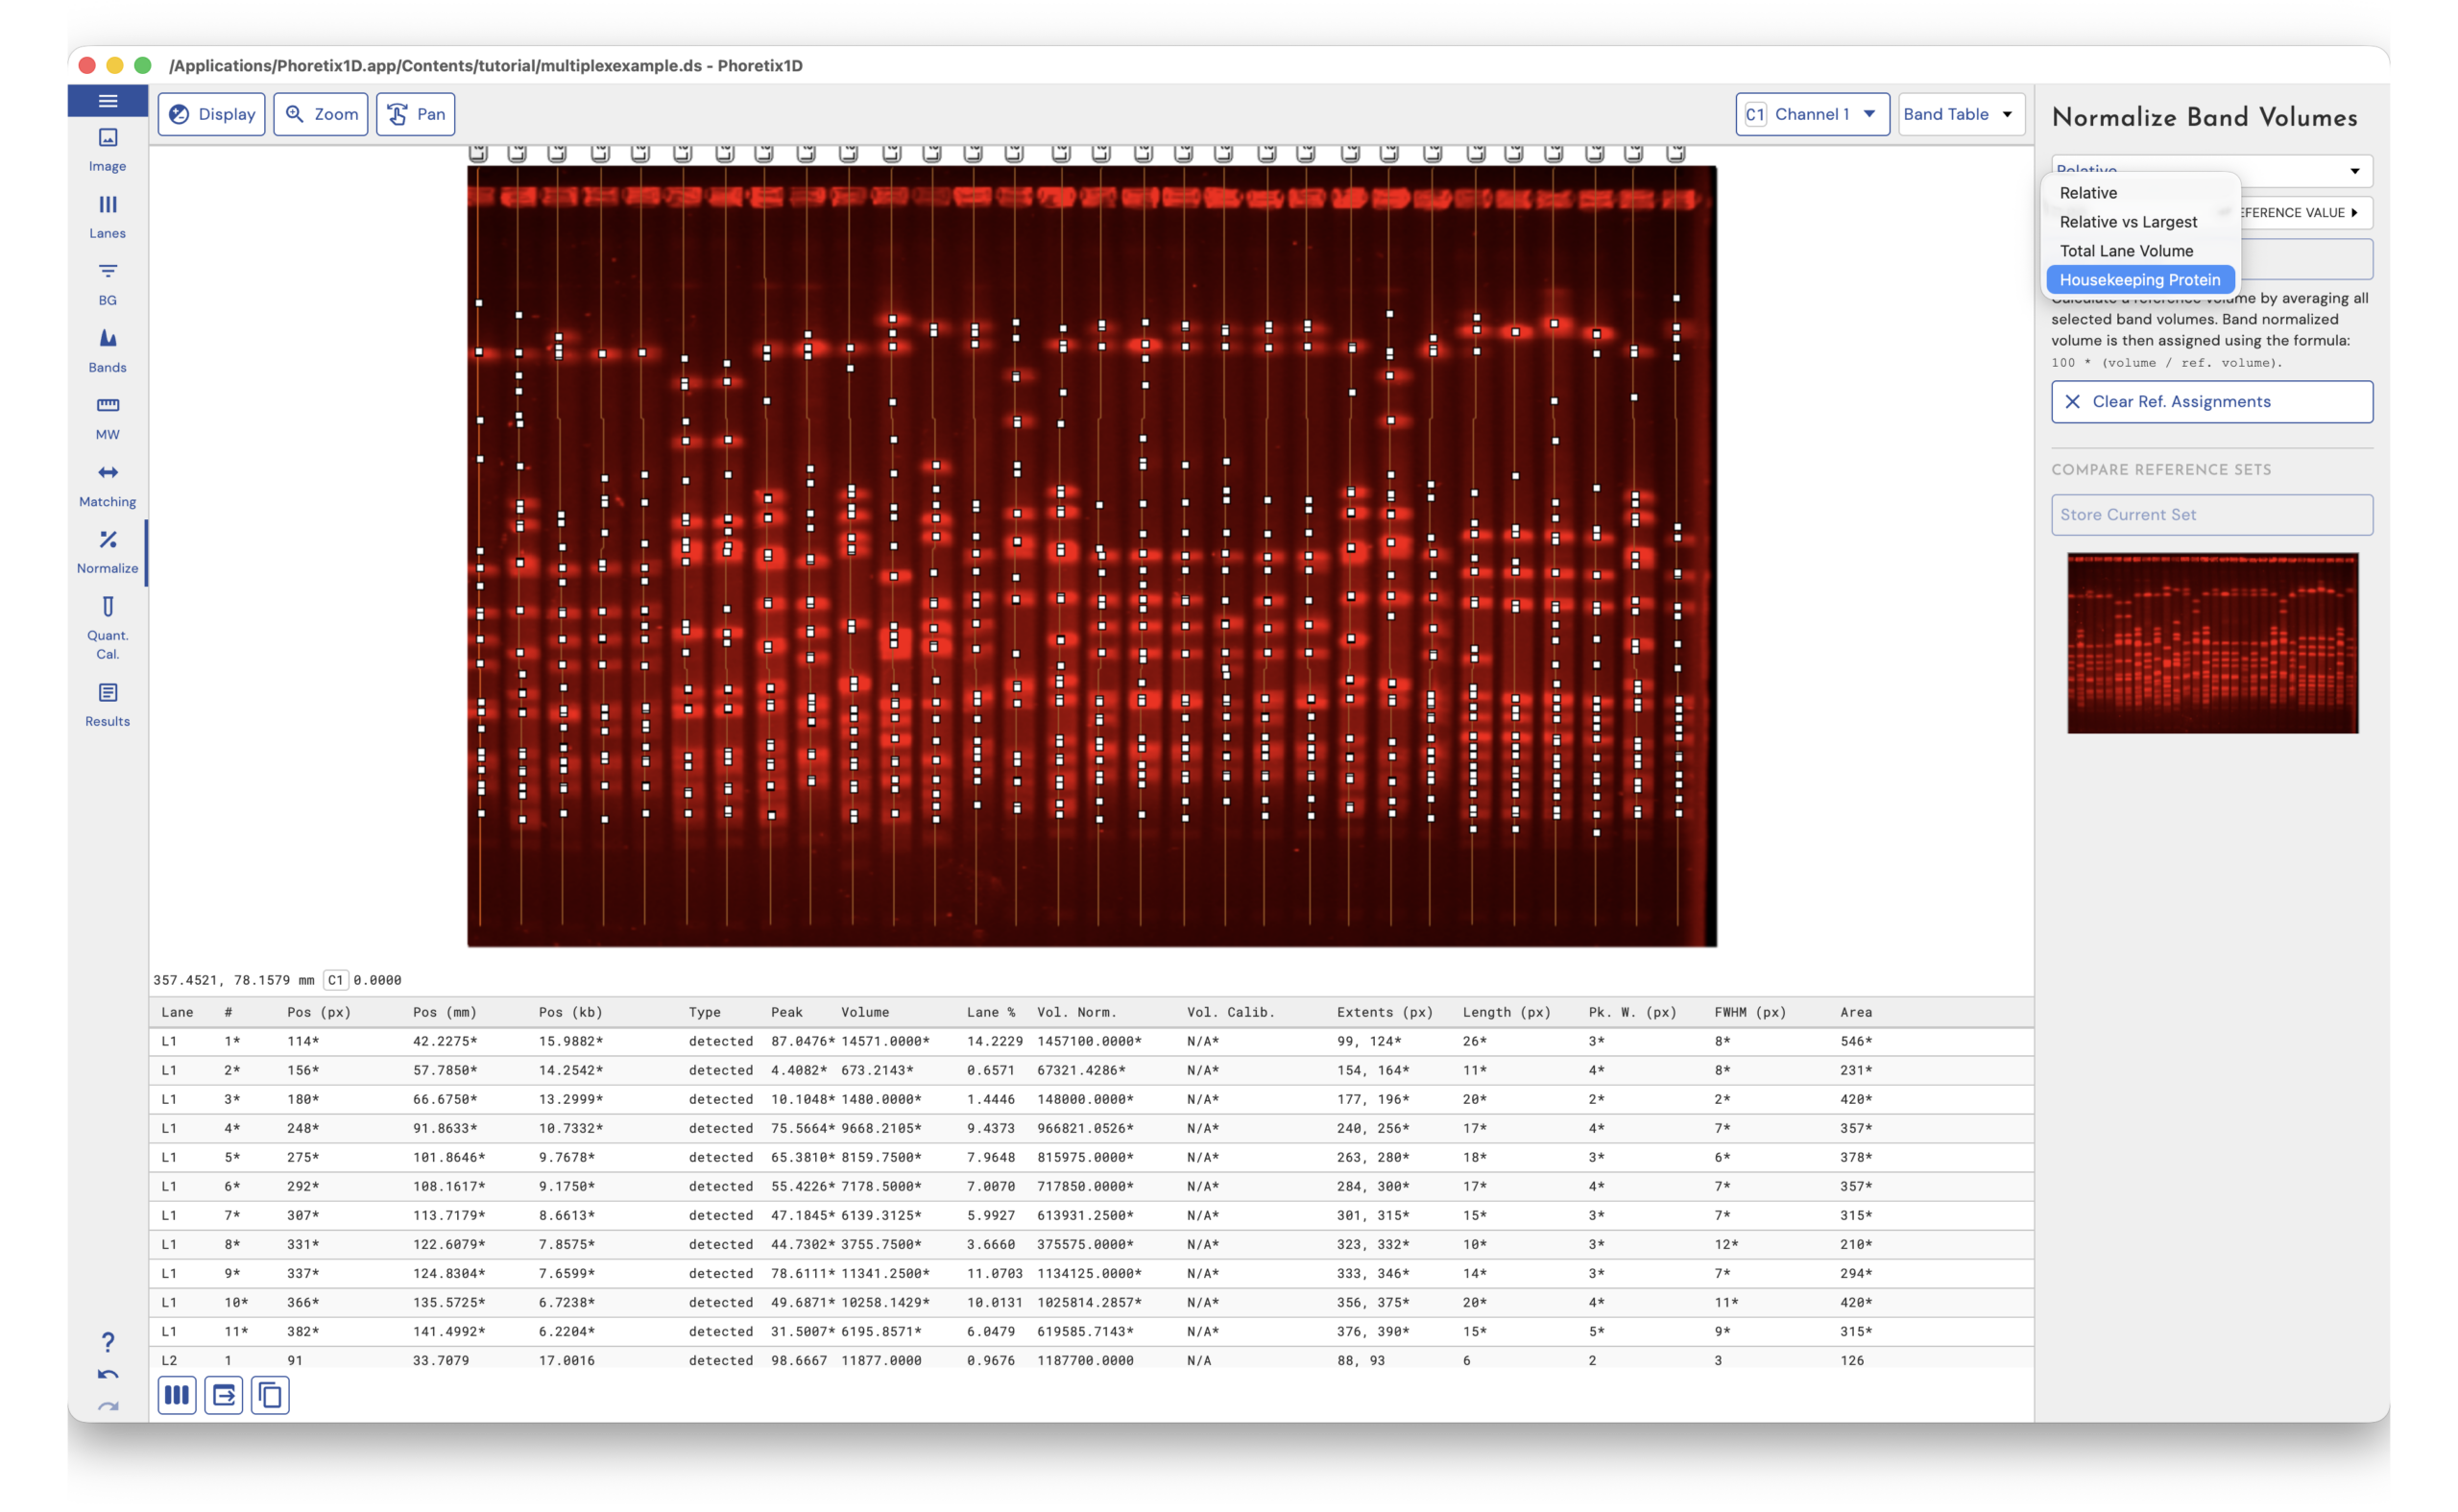
It has two weaknesses that are well documented. First, housekeeping expression is not constant. Beta-actin and GAPDH change with cell density, differentiation, hypoxia, glucose, tissue type, developmental stage and many treatments, and when the loading control moves, every normalized value moves with it in the wrong direction. Second, these proteins are abundant. At loadings chosen to make a low-abundance target visible, the housekeeping band is often saturated, so it stops reporting loading differences at all. Both problems are avoidable if you validate the control for your system: run a dilution series to confirm the housekeeping band is in its linear range at your loading, and check in a pilot that your treatment does not change it. If you cannot show both, use total protein.
How to calculate western blot normalization, step by step
The arithmetic is the same whichever loading control you use. It takes two divisions.
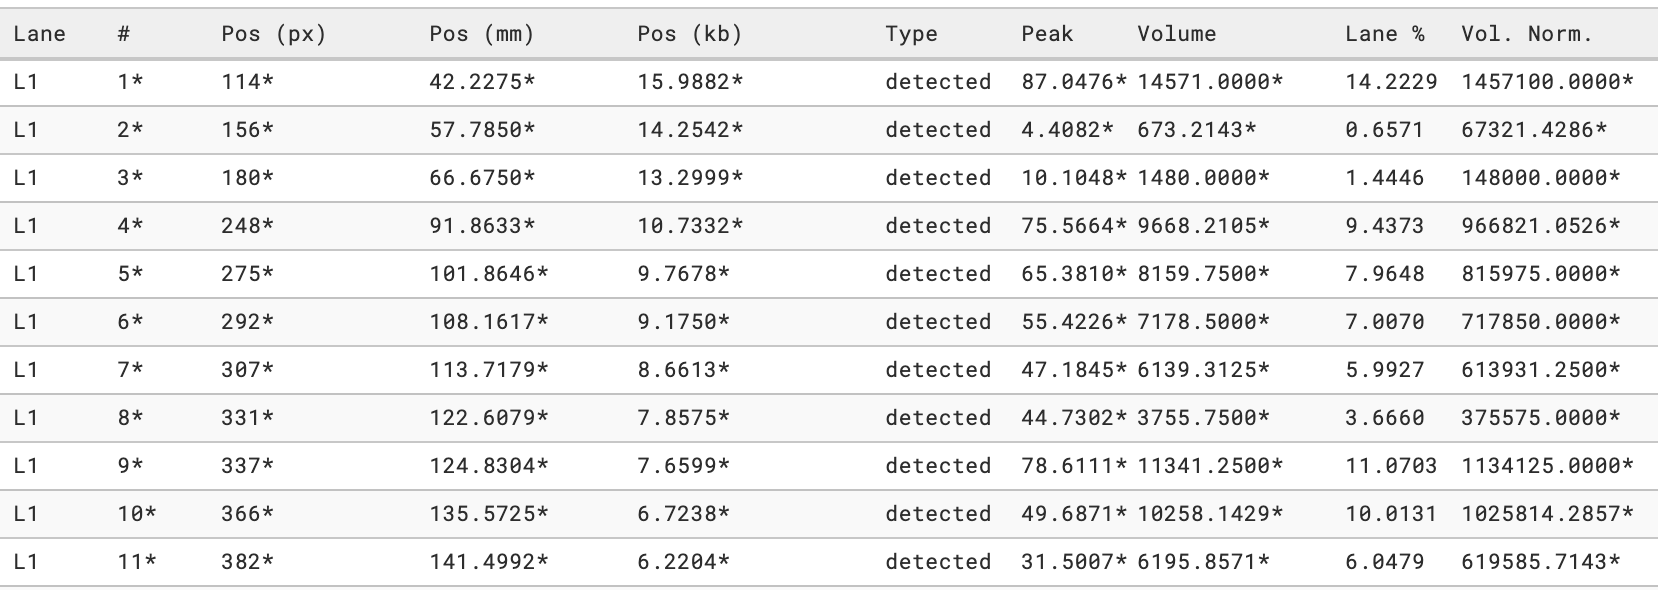
- Quantify the target band in every lane: the background-subtracted integrated intensity, also called band volume. Use one background subtraction method and apply it to every lane.
- Quantify the loading control in the same lanes with the same method: the housekeeping band, or the total lane volume from the stain image.
- Confirm neither the target nor the loading control is saturated in any lane. A saturated band cannot be normalized; re-expose.
- Divide each lane’s target by its loading control. This is the normalized intensity. Its absolute value is arbitrary; only the ratios between lanes matter.
- Divide each lane’s normalized intensity by the normalized intensity of your control condition. The control becomes 1.00 and every other lane is a ratio to control, which is the same number as fold change.
- Repeat across biological replicates and apply your statistics to the ratios.
| Step | Control lane | Treated lane | Note |
|---|---|---|---|
| Target band volume (background subtracted) | 1,200,000 | 1,850,000 | Integrated intensity inside the band boundary after background subtraction; arbitrary units |
| Beta-actin band volume (background subtracted) | 950,000 | 980,000 | Same lane as the target; same background method; confirmed in the linear range by a dilution series |
| Normalized intensity (target divided by beta-actin) | 1.263 | 1.888 | Corrects for the amount of protein that actually reached each lane |
| Ratio to control (normalized value divided by the control's normalized value) | 1.00 | 1.49 | The control becomes 1.0; the treated sample shows a 1.49-fold increase |
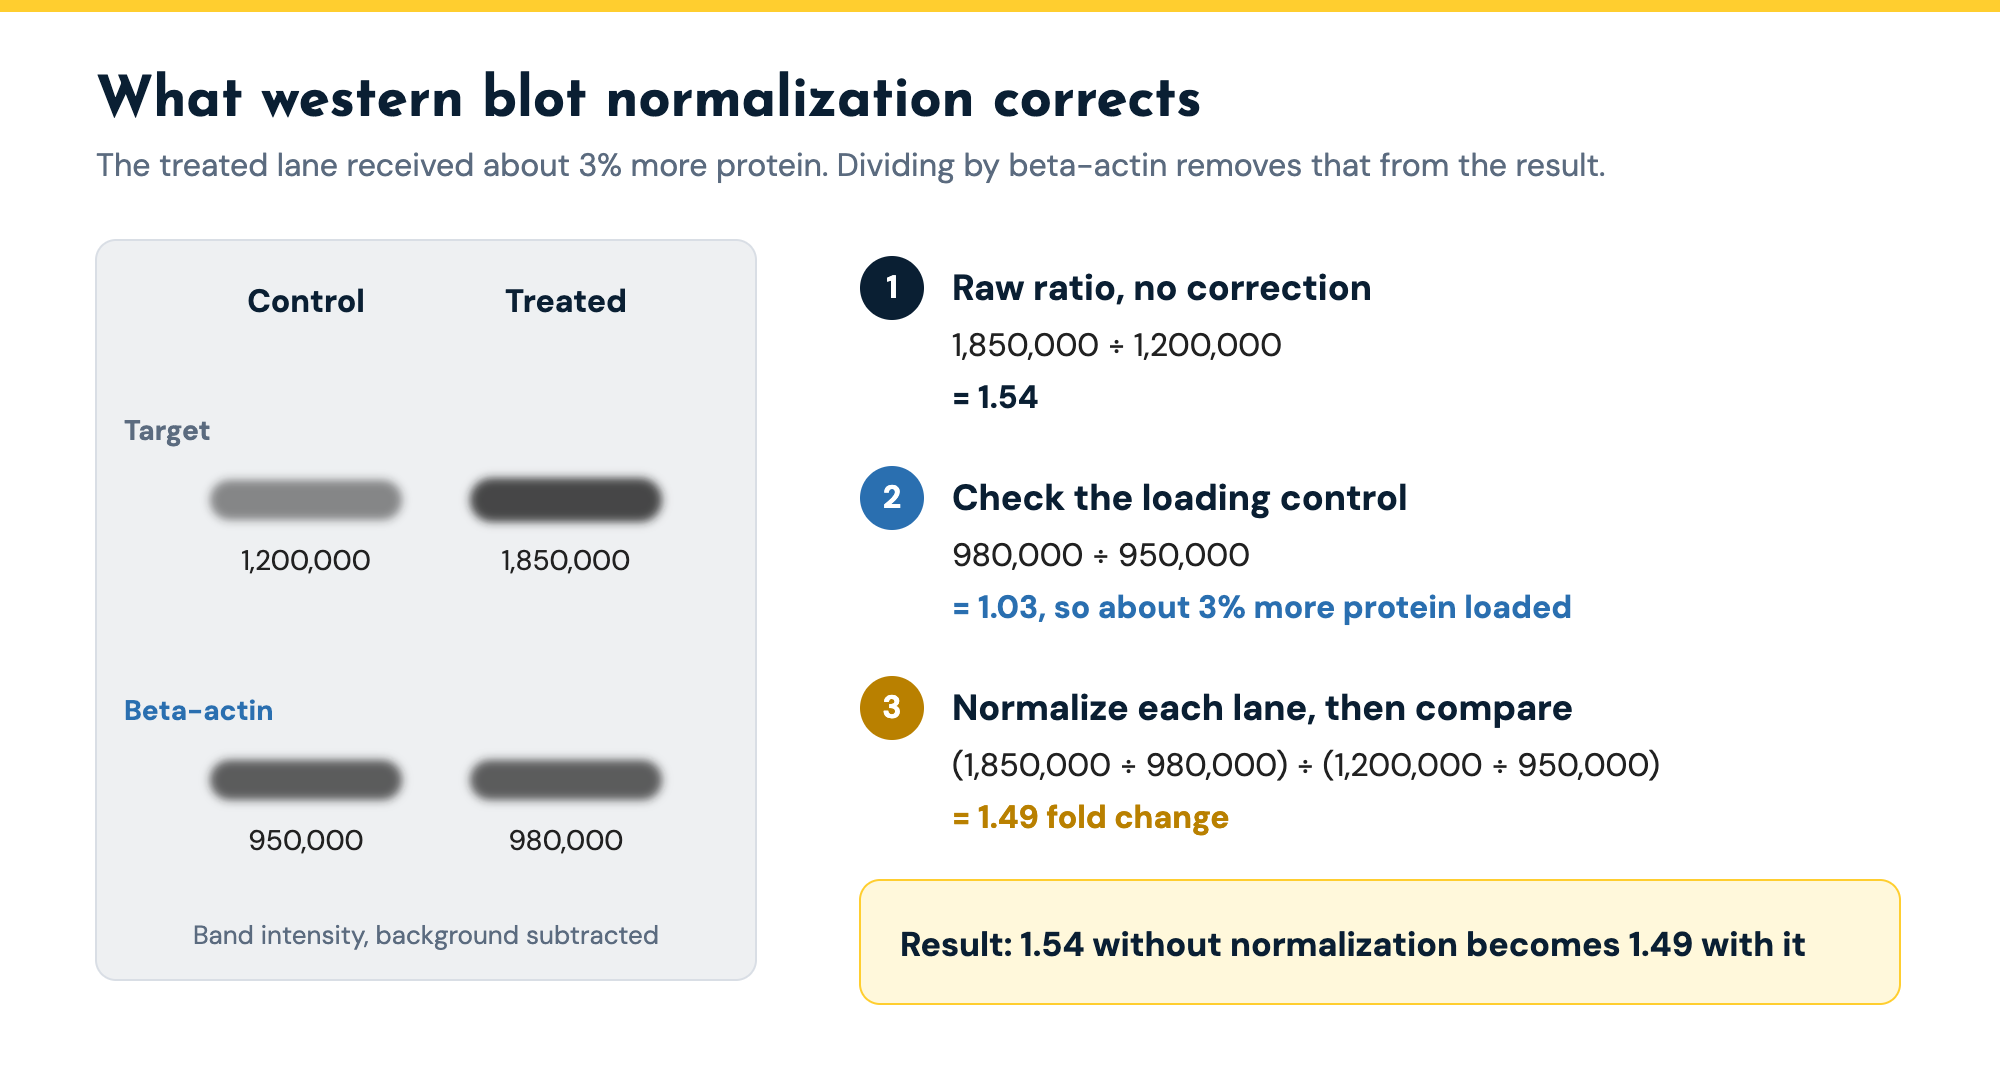
| For comparison: raw ratio with no normalization | 1.00 | 1.54 | The treated lane received about 3% more protein, which inflates the unnormalized ratio |
Western blot normalization to a housekeeping protein: one target band and its beta-actin loading control in a control and a treated lane, normalized and expressed as a ratio to control. Intensities are background-subtracted band volumes in arbitrary units.
The treated lane received about 3% more protein than the control lane, which is visible in the beta-actin values. Without normalization the raw target ratio would read 1.54; normalization corrects it to 1.49. Some protocols describe the same calculation as a normalization factor: divide the reference lane’s loading control by each lane’s loading control, then multiply each target by its factor. The result is identical; the two-division form above is simply how most methods sections describe it.
The total protein version of the calculation
Total protein normalization runs the same two divisions with the total lane volume in place of the housekeeping band. TABLE 2 uses the same target values as TABLE 1 so the two methods can be compared directly.
| Step | Control lane | Treated lane | Note |
|---|---|---|---|
| Target band volume (background subtracted) | 1,200,000 | 1,850,000 | Same target values as Table 1 |
| Total lane volume from the stain-free image (background subtracted) | 45,000,000 | 46,800,000 | Whole lane quantified as one value at an exposure with no saturated pixels; same lane boundaries and background method as the target |
| Normalized intensity (target divided by total lane volume) | 0.02667 | 0.03953 | Absolute value is arbitrary; only the ratio between lanes matters |
| Ratio to control (normalized value divided by the control's normalized value) | 1.00 | 1.48 | Agrees with the beta-actin result (1.49) because the loading control is sound in both cases |
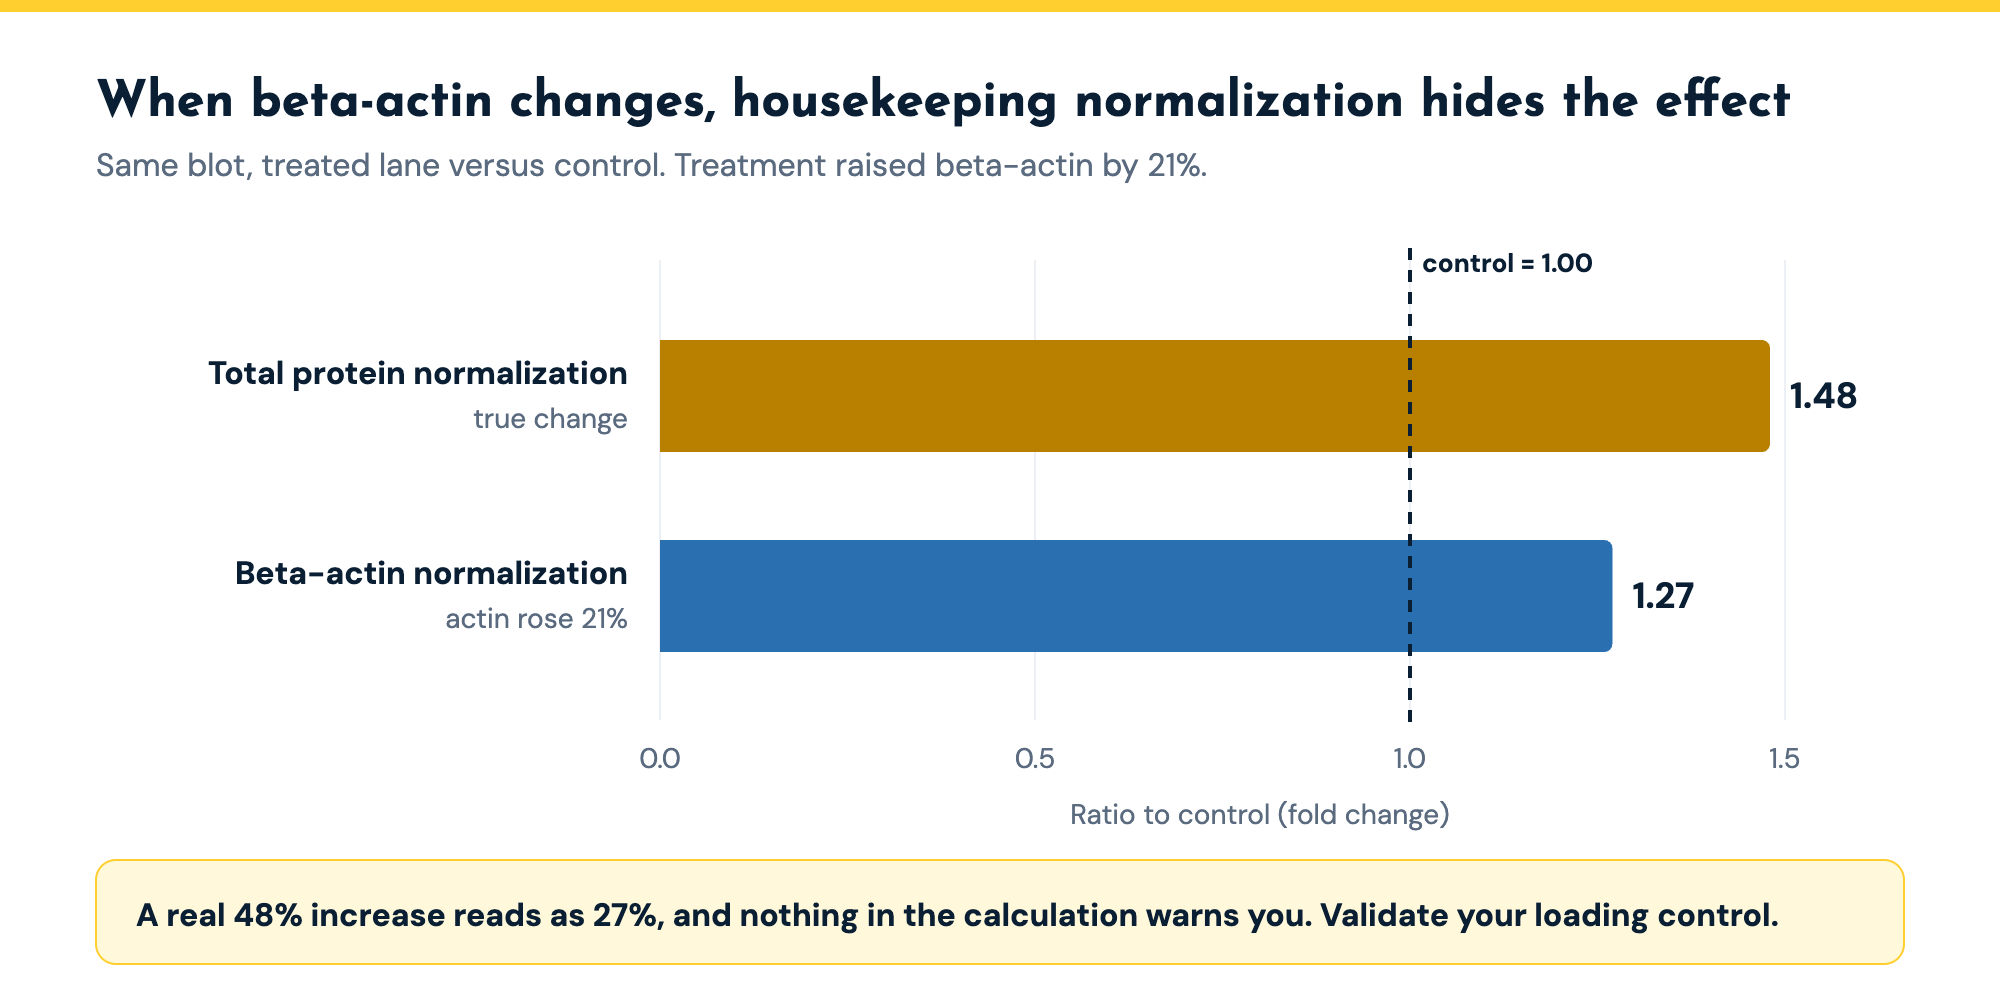
| If beta-actin had risen 21% with treatment (to 1,150,000) | 1.00 | 1.27 by housekeeping / 1.48 by total protein | Housekeeping normalization understates the change and gives no warning; total protein, integrating over the whole lane, does not |
The same target protein normalized to total lane protein from a stain-free image. The total lane volumes differ by about 4%, matching the loading difference seen in the beta-actin control, and the two methods agree: 1.48 against 1.49.
When the loading control is sound, the two methods agree to within rounding, as they do here. They disagree when the housekeeping protein is not constant. Suppose the treatment in this example also raised beta-actin by 21%, to 1,150,000 in the treated lane. Housekeeping normalization would now give a normalized treated value of 1.609 and a ratio to control of 1.27, reporting a real 1.48-fold change as 1.27-fold and shrinking the measured effect by almost half, and nothing in the calculation would warn you. Total protein normalization, integrating over the whole lane, would still return 1.48. That is the practical case for total protein, and it is also the reason a housekeeping control should be validated against your treatment before you trust it.
Western blot normalization calculator
Enter the background-subtracted intensities for your target and loading control in each lane and the calculator returns the normalized intensity, the ratio to control and the fold change. It works for a housekeeping band or a total lane volume.
Western blot normalization and fold change calculator
Enter the background-subtracted intensity of your target band and its loading control in each lane. Tick the control lane (or lanes). The calculator divides target by loading control, then expresses every lane as a ratio to control, which is the same number as fold change.
| Lane / sample | Target intensity | Loading control intensity | Control? | Remove |
|---|
Intensities are integrated band volumes in any unit, as long as every lane uses the same unit and the same background subtraction method. Commas in numbers are fine. The calculation runs in your browser; nothing is sent anywhere.
Skip the spreadsheet. Phoretix 1D detects lanes and bands, applies one background method to every lane, normalizes to a housekeeping band or total lane protein and reports the ratio to control for you.
Start your free Phoretix 1D trialHousekeeping protein versus total protein normalization
| Criterion | Housekeeping protein normalization | Total protein normalization |
|---|---|---|
| What is measured | One reference band (beta-actin, GAPDH, tubulin) detected with a second antibody | All protein in the lane, from a stain-free gel or a Ponceau S, REVERT or SYPRO Ruby stained membrane |
| Assumption | The reference protein is expressed equally in every sample and unchanged by the treatment | Total protein per lane reflects loading; no single protein dominates the signal |
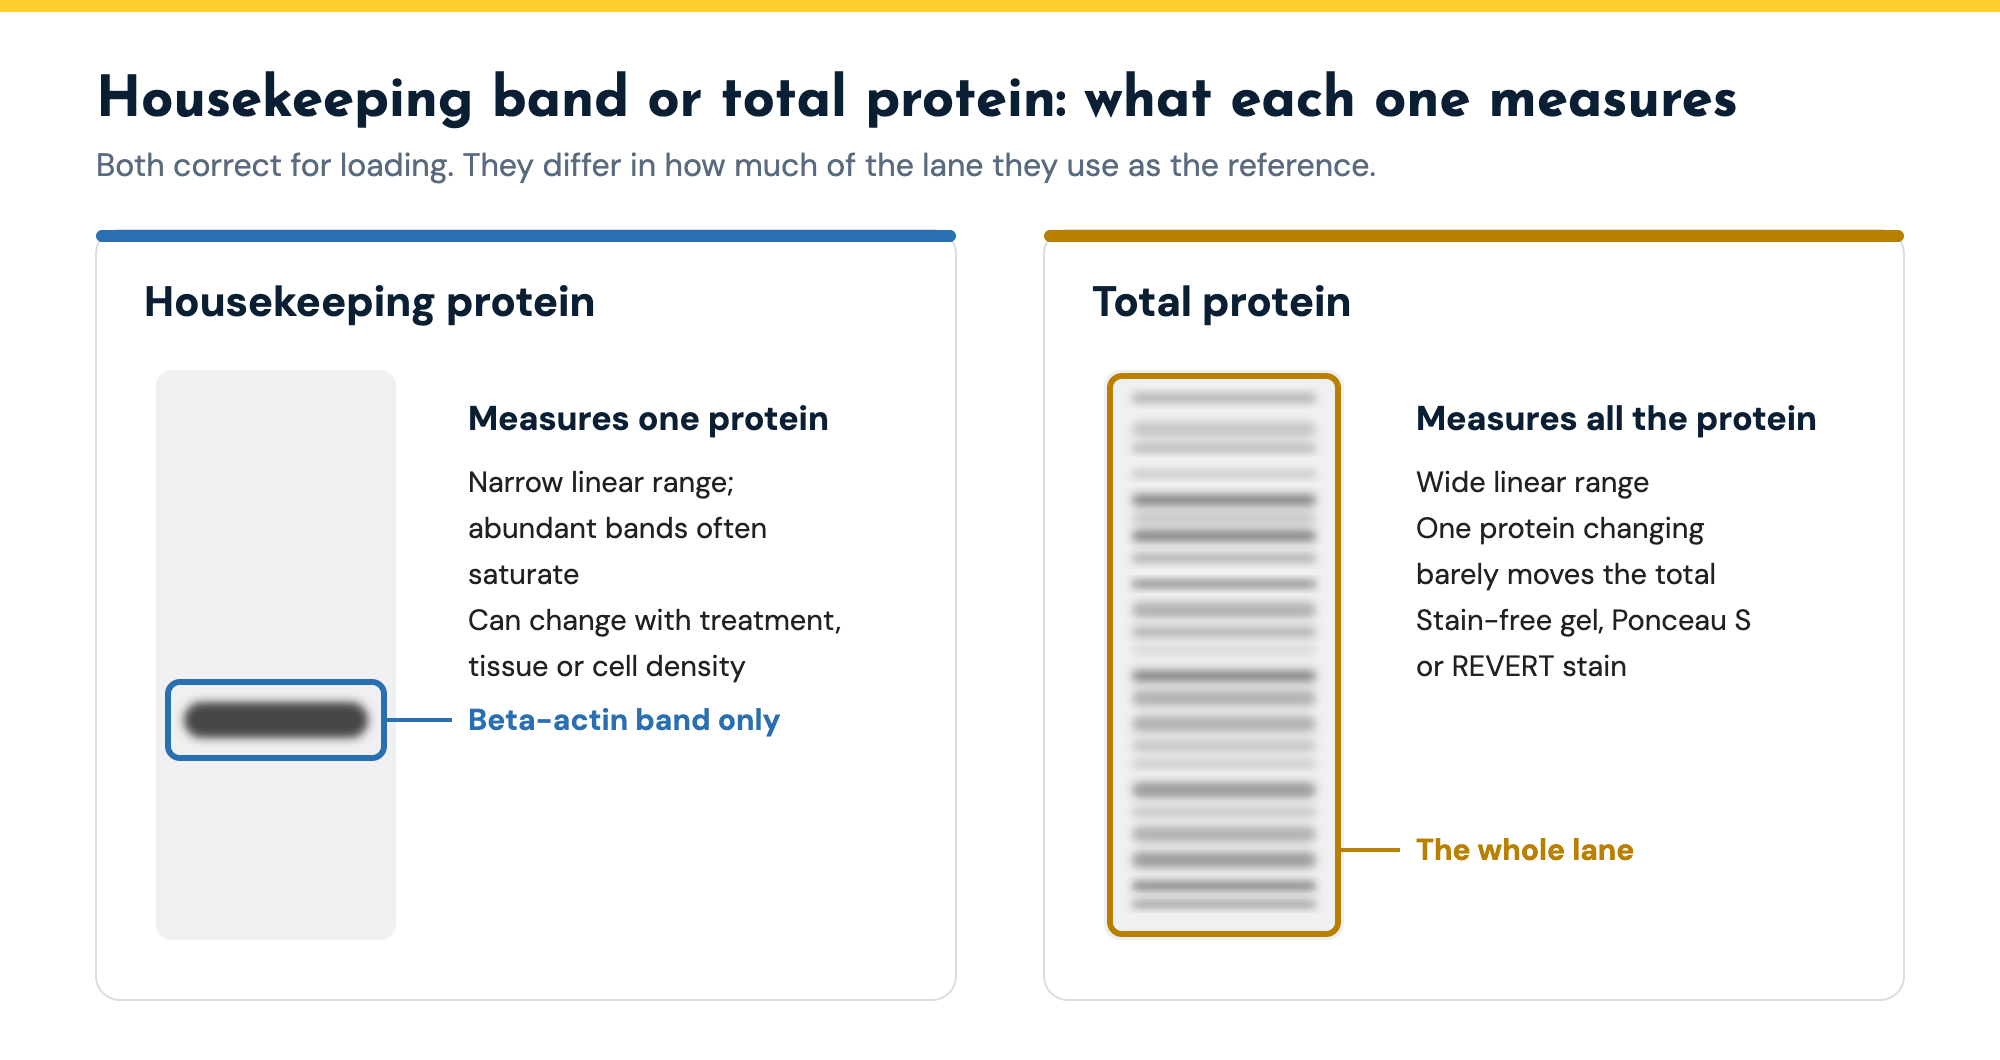
| Linear range | Narrow; abundant housekeeping proteins are often saturated at loadings chosen for a low-abundance target | Wide; the summed signal of hundreds of proteins stays linear across typical loadings |
| Sensitivity to your treatment | High; beta-actin and GAPDH change with density, differentiation, hypoxia, glucose, tissue and many treatments | Low; a change in any one protein is a small fraction of the whole lane |
| Validation needed | Dilution series to confirm the linear range, plus a pilot blot showing the control does not change across conditions | Confirm the stain image is unsaturated at your loading |
| Requirements | A second primary antibody and a channel or strip for it; works with any imager | Stain-free gels with a UV-capable imager, or a membrane stain and an imager that captures it |
| Extra cost and time | Second antibody and incubation; sometimes stripping and reprobing | Staining step or stain-free gels; imaging the stain before blocking |
| Journal and supplier guidance | Accepted when validated; increasingly questioned by reviewers | Recommended for quantitative blots by major journals and reagent suppliers |
| Choose it when | Total protein imaging is not available, a protocol or reviewer requires it, and the control has been validated in your system | Any quantitative blot where you can stain the membrane or run a stain-free gel; especially when treatments may alter housekeeping expression |
| Phoretix 1D setting | Normalize to a selected reference band or housekeeping channel on a multiplex blot | Normalize to the total lane volume from the stain image |
How housekeeping protein and total protein normalization compare on what they measure, linear range, sensitivity to your treatment, what they require and where each is the right choice.
The short version: total protein normalization is the more robust method and the one to reach for on any quantitative blot where you can stain the membrane or run a stain-free gel. Housekeeping protein normalization remains acceptable when you have validated the control’s linear range and stability in your system, when your imaging setup cannot capture a total protein signal, or when a reviewer or protocol specifically requires it. Whichever you choose, use it consistently across an experiment and say which one you used.

Five mistakes that break western blot normalization
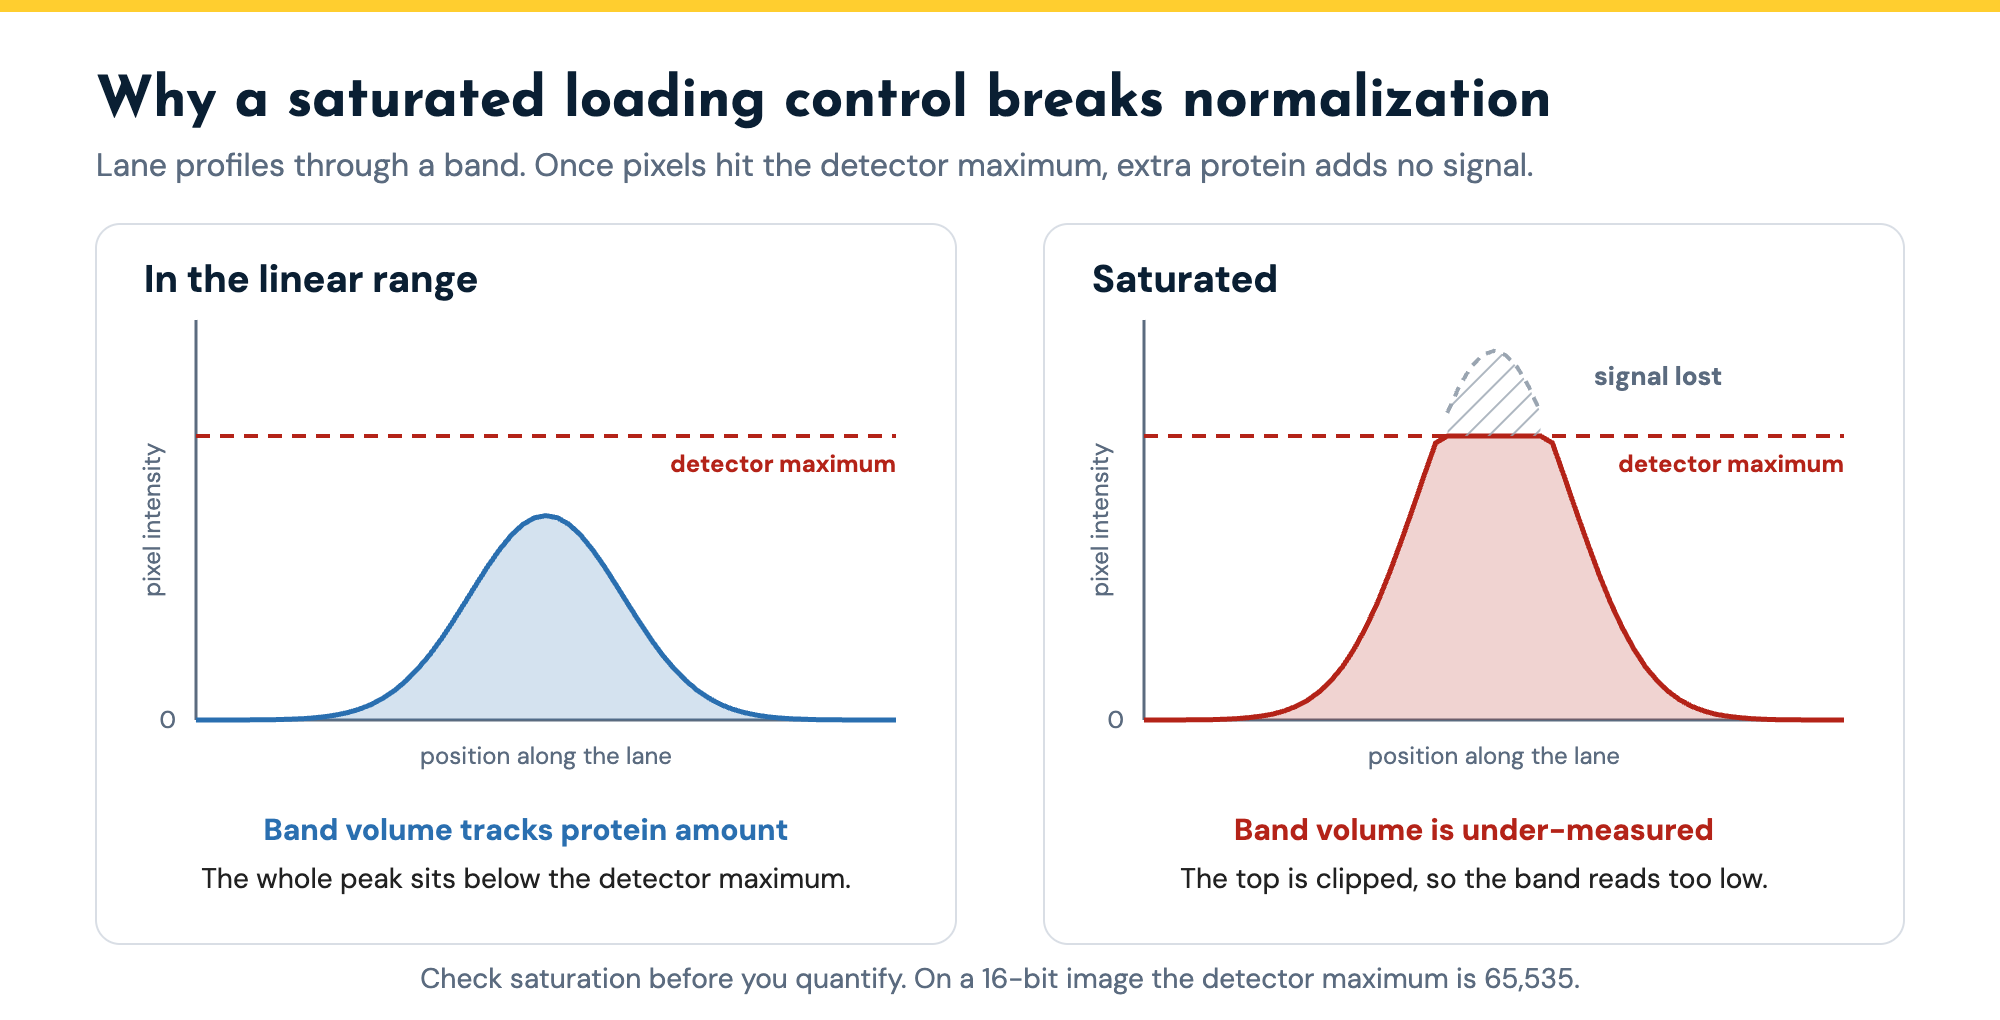
- Normalizing to a saturated loading control. The commonest failure. An abundant housekeeping band at a normal loading is frequently at the detector ceiling, so it reports the same value for every lane and corrects nothing. Check the saturation view on your imager or in your analysis software before you divide by anything.
- Using different background methods for target and control. Background subtraction changes band values by different amounts depending on the method; if the target used rolling ball and the loading control used a manual baseline, the ratio carries an artifact. One method, one set of parameters, every band.
- Normalizing across blots. A loading control corrects within a blot, not between blots exposed on different days. To compare across blots, run a common calibrator sample on each and normalize to it as well.
- Trusting a housekeeping protein you have not tested. Beta-actin and GAPDH change with more treatments than most protocols assume. A pilot blot comparing the housekeeping band across your conditions at your loading takes one afternoon and protects the whole study.
- Reporting raw intensities. Absolute band volumes depend on exposure, substrate lot and imager and are meaningless between labs. Report the normalized ratio to control, state the loading control and the number of replicates, and keep the raw images.

How to report normalization in your methods section
A reproducible methods sentence names the loading control, the software, how results are expressed and the evidence for the linear range:
“Band intensities were quantified by densitometry using Phoretix 1D version [X] (TotalLab Ltd, Newcastle upon Tyne, UK) with [rolling ball] background subtraction, normalized to [total protein in the same lane measured from the stain-free gel / beta-actin in the same lane], and expressed as a ratio to the [control] condition. Loading was confirmed to be within the linear range of detection by a dilution series.”
State the number of biological replicates and the statistical test in the figure legend, and keep the uncropped blots, the stain image and the saved analysis file; many journals now ask for them.
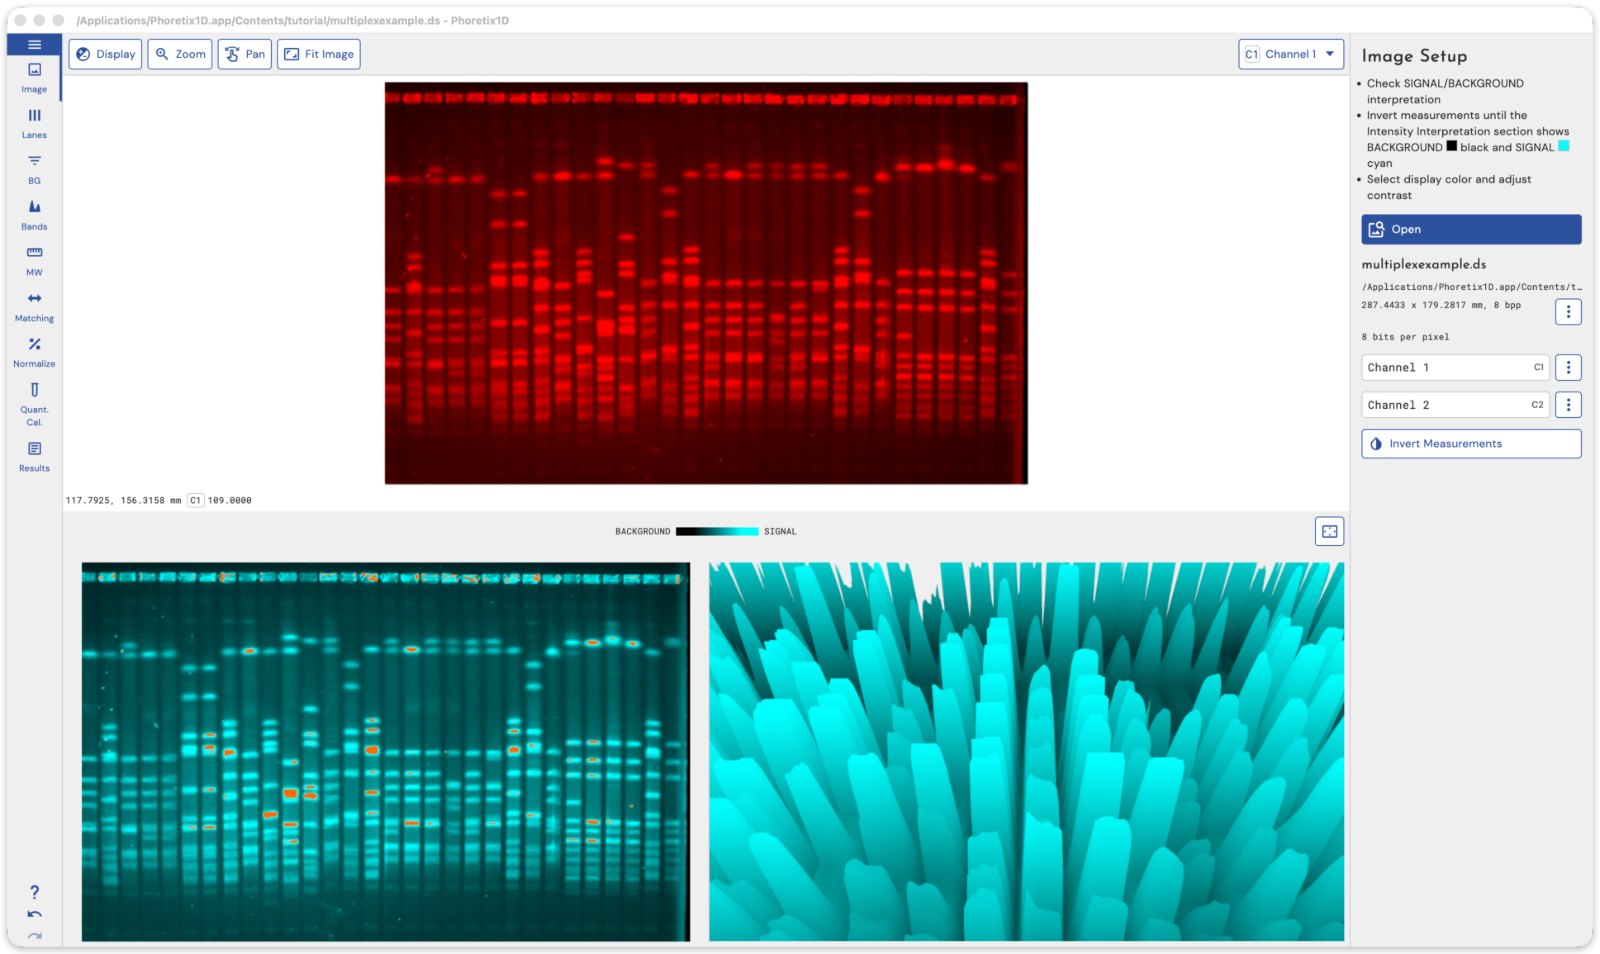
Phoretix 1D detects lanes and bands automatically, applies one background method to every lane, normalizes to a housekeeping band, a housekeeping channel on a multiplex blot, or the total lane volume, reports the ratio to control in a PDF and CSV, and includes a 3D view that shows saturated bands before you quantify them. It runs on Windows, macOS and Linux with images from any imager. The software comparison guide sets it beside ImageJ and the imager-bundled packages.
Frequently asked questions
Q: What is western blot normalization?
A: Normalization corrects the measured intensity of a target protein band for the amount of protein that actually reached each lane. The target is divided by a loading control measured in the same lane, either the total protein in the lane or a housekeeping protein band such as beta-actin, so that differences between lanes reflect biology rather than pipetting, loading or transfer differences.
Q: How do you normalize western blot data?
A: Quantify the background-subtracted intensity of the target band and of the loading control in every lane, using the same background method for both. Divide target by loading control in each lane to get the normalized intensity. Then divide each lane’s normalized intensity by that of the control condition, so the control equals 1.0 and the other lanes are ratios to control. Run statistics on those ratios across biological replicates.
Q: Should I normalize to total protein or a housekeeping protein?
A: Total protein normalization is more robust: it integrates over the whole lane, has a wider linear range, and is not distorted by one protein changing with your treatment. It is what journals and reagent suppliers now recommend. Housekeeping normalization is acceptable when you have confirmed the control is in its linear range at your loading and does not change with your treatment, or when your imaging setup cannot capture a total protein signal.
Q: What are the best housekeeping proteins for western blot?
A: Beta-actin, GAPDH and tubulin are the most widely used, with vinculin, HSP90 and lamin B1 used for particular compartments. None is reliable in every system: all can change with cell density, differentiation, hypoxia, tissue type and treatment, and all are abundant enough to saturate at normal loadings. Validate the one you choose with a dilution series and a pilot blot across your conditions.
Q: How do you calculate fold change from a western blot?
A: Fold change is the normalized intensity of a sample divided by the normalized intensity of the control condition. Normalize first (target divided by loading control in each lane), then divide each normalized value by the control’s; a value of 1.49 means a 1.49-fold increase relative to control. It is the same number as the ratio to control.
Q: Can I normalize across different blots?
A: Not with a loading control alone. A loading control corrects for loading within a blot, but separate blots differ in transfer, antibody incubation and exposure. To compare across blots, include the same calibrator sample on every blot and express each blot’s results relative to it, in addition to loading-control normalization within each blot.
Q: What is stain-free total protein normalization?
A: Stain-free gels contain a compound that reacts with tryptophan residues under UV light, making the proteins fluoresce so the whole lane can be imaged and quantified without a separate staining step. The total lane signal is then used as the loading control. It requires stain-free gels and an imager with the matching UV channel; Ponceau S, REVERT and SYPRO Ruby membrane stains achieve the same total protein normalization on ordinary gels.
Q: What software calculates western blot normalization?
A: Any gel analysis software that reports band intensities can supply the inputs, and the two divisions can be done in a spreadsheet or with the calculator on this page. Dedicated software such as TotalLab’s Phoretix 1D detects lanes and bands automatically, normalizes to a housekeeping band or total lane volume, and reports the ratio to control directly, which removes the spreadsheet step and the operator judgments that go with it.
Normalize every lane the same way, automatically
Phoretix 1D quantifies the target and the loading control with one background method, normalizes to a housekeeping band or total lane protein, flags saturated bands in its 3D view, and reports the ratio to control with a PDF and CSV. Free trial, any imager, Windows, macOS and Linux.
References
1. Taylor SC, Posch A. The design of a quantitative western blot experiment. BioMed Research International. 2014;2014:361590. DOI 10.1155/2014/361590.
(Source for: linear dynamic range and the dilution series; total protein normalization; housekeeping-protein saturation.)
2. Eaton SL, Roche SL, Llavero Hurtado M, et al. Total protein analysis as a reliable loading control for quantitative fluorescent Western blotting. PLoS ONE. 2013;8(8):e72457. DOI 10.1371/journal.pone.0072457.
(Source for: total protein as a more reliable loading control than single housekeeping proteins.)
3. Dittmer A, Dittmer J. Beta-actin is not a reliable loading control in Western blot analysis. Electrophoresis. 2006;27(14):2844-2845. DOI 10.1002/elps.200500785.
(Source for: beta-actin expression changing with experimental conditions.)
4. Ghosh R, Gilda JE, Gomes AV. The necessity of and strategies for improving confidence in the accuracy of western blots. Expert Review of Proteomics. 2014;11(5):549-560. DOI 10.1586/14789450.2014.939635.
(Source for: housekeeping protein variability with density, differentiation, hypoxia and treatment; saturation of abundant loading controls.)
5. Pillai-Kastoori L, Schutz-Geschwender AR, Harford JA. A systematic approach to quantitative Western blot analysis. Analytical Biochemistry. 2020;593:113608. DOI 10.1016/j.ab.2020.113608.
(Source for: establishing the linear range; total protein normalization workflow; validating housekeeping controls.)
6. Gassmann M, Grenacher B, Rohde B, Vogel J. Quantifying Western blots: pitfalls of densitometry. Electrophoresis. 2009;30(11):1845-1855. DOI 10.1002/elps.200800720.
(Source for: saturation and background subtraction as sources of error.)
7. Fosang AJ, Colbran RJ. Transparency is the key to quality. Journal of Biological Chemistry. 2015;290(50):29692-29694. DOI 10.1074/jbc.E115.000002.
(Source for: journal expectations for quantitative blots, linear range evidence and uncropped blots.)
8. TotalLab. Phoretix 1D product page. https://totallab.com/software/1d-gel-western-blot-analysis-software/
(Source for: normalization to a reference band, housekeeping channel or total lane volume; multichannel images; automatic lane and band detection; PDF and CSV export; Windows, macOS and Linux; any imager.)
9. TotalLab. How to calculate western blot normalization (current version of this page, September 2026).
(Source for: the 3D view for identifying saturated bands, carried over from the existing copy.)
10. TotalLab customer-language analysis of 2,907 papers citing TotalLab 1D software and the full text of 487 open-access papers, September 2026 (internal).
(Source for: beta-actin named in about one in six citing contexts, with GAPDH and tubulin behind it.)
11. Steven Dodd, TotalLab, 7 October 2026 (internal).
(Source for: Phoretix 1D background subtraction options: none, rolling ball, rubber band, constant value, profile minimum, image rectangle, lane edge and manual.)