
Guide
Most western blot problems show up in the image before anything else: a gray haze over the membrane, bands that smear down the lane, a ladder with nothing beside it. This guide is organized by what you see. For each problem it gives the likely causes, the first thing to change, and an answer to the question that decides your next week: can you still quantify this blot, or do you need to run it again?
Start with the transfer. A Ponceau S stain of the membrane takes a few minutes and tells you whether the problem happened before or after the proteins reached the membrane.
On this page
- Western blot problems at a glance
- Check the transfer first: reading a Ponceau stain
- High background
- No bands or weak signal
- Smeared bands
- Extra bands or bands at the wrong size
- Smiling, curved or uneven bands
- White bands, saturated bands and overloaded lanes
- Patches and spots
- Can you still quantify it, or do you need to re-run?
- Preventing the next problem
- Frequently asked questions
Western blot problems at a glance
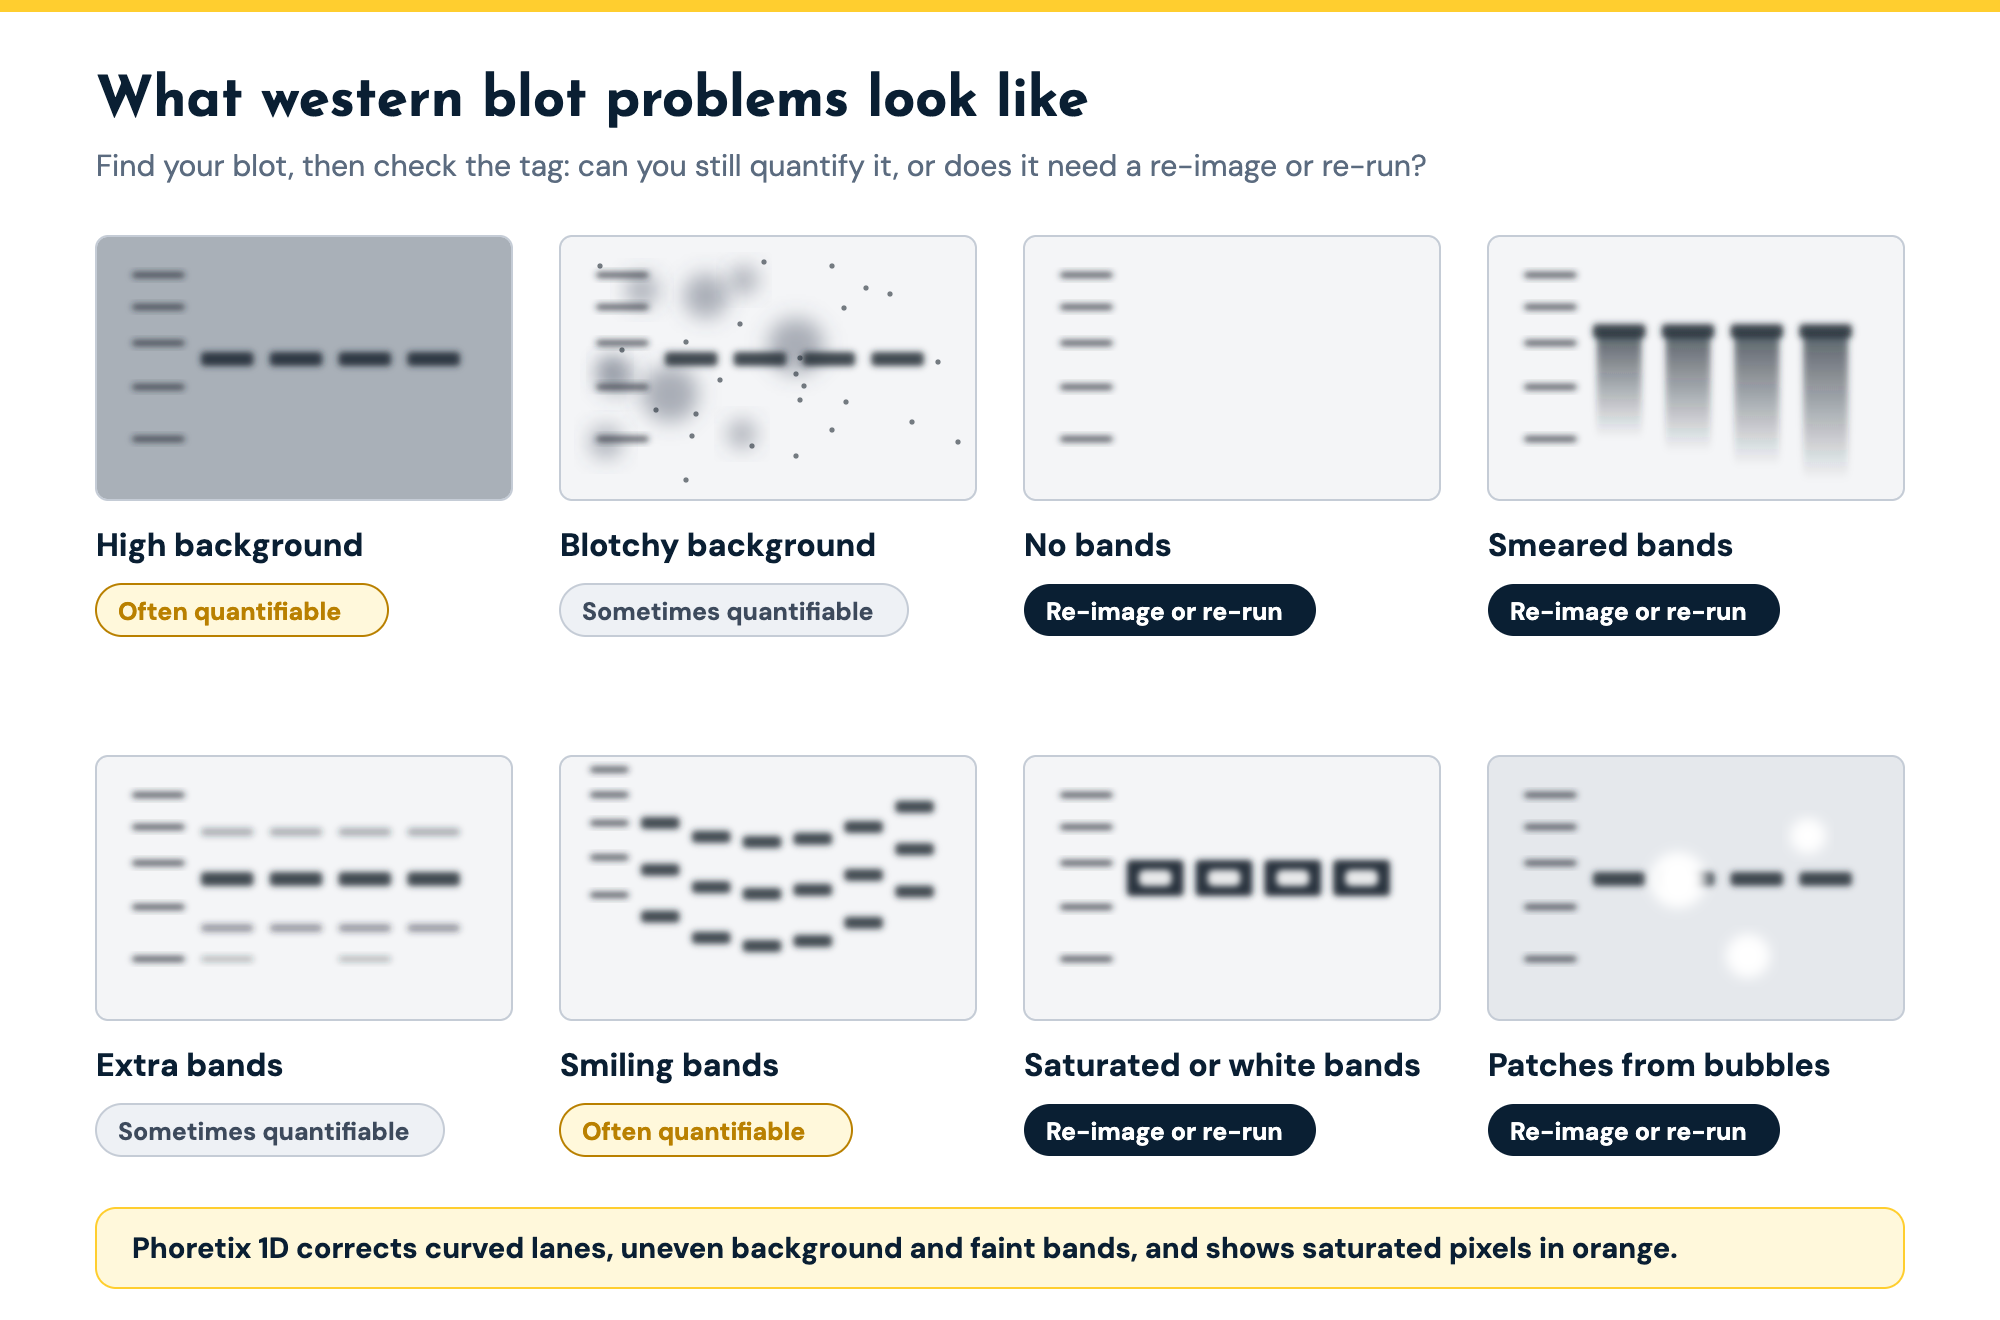
| Problem | What it looks like | Likely causes | First fix | Can you still quantify it? |
|---|---|---|---|---|
| High background | Gray or dark haze over the whole membrane | Antibody too concentrated, short blocking, too little washing, old buffers, long exposure, PVDF | Dilute antibodies, add washes, block about 1 hour, shorten exposure | Often: background subtraction, if bands stand clear of it |
| Blotchy or speckled background | Dark blotches, speckles or streaks | Uneven agitation, contaminated blocking agent, aggregated secondary | Use a shaker, filter the blocker, centrifuge or filter the secondary | Partly: lane-by-lane background, not spots on a band |
| No bands | Ladder visible, no target band | Failed transfer, antibody not validated for western blot, wrong secondary, no antigen, sodium azide with HRP | Ponceau stain, positive control, check secondary species, azide-free buffers | No: nothing to measure |
| Weak bands | Bands barely above background | Too little antibody or antigen, over-washing, short exposure, milk masking the antigen | More antibody or protein, BSA instead of milk, longer exposure without saturating | Often: faint-band detection and noise reduction, if above background |
| Smeared bands | Vertical smears instead of tight bands | Degraded protein, voltage too high, bubbles during transfer | Fresh cold samples with protease inhibitors, lower voltage | Rarely: a smear has no clear edge |
| Extra or wrong-size bands | Bands above or below the expected size | Degradation (lower), incomplete denaturation (higher), isoforms, similar epitopes | Fresh samples, reheat the sample, check antibody validation | Yes: if the target band is fully separated |
| Smiling, curved or uneven bands | Bands curve up at the gel edges or lanes lean | Voltage too high, gel overheating, fast migration at low resistance | Lower voltage, match the gel to the sample | Usually: bend lanes, anchor MW with a ladder at each side |
| White or saturated bands | White or negative bands, or flat-topped bands at maximum intensity | Too much protein or antibody, exposure too long, abundant protein | Shorter exposure, load less, dilute the antibody | No: re-image or re-run |
| Patches and spots | Areas of missing or uneven signal | Air bubbles in the transfer sandwich, uneven agitation, aggregated secondary | Roll out bubbles, agitate every step | Only lanes the patch does not touch |
Common western blot problems by appearance, their likely causes, the first fix, and whether analysis software can still give you a usable number.
Check the transfer first: reading a Ponceau stain
Ponceau S is a reversible red stain for total protein on the membrane. Staining after transfer shows you the protein that is actually there to detect, which splits every troubleshooting problem in two (ref 2). If the Ponceau image looks right, the problem is in blocking, antibodies or detection. If it does not, no amount of antibody optimization will fix it.
| What the Ponceau stain shows | What it means | What to try next |
|---|---|---|
| Even bands in every lane | The transfer worked | Look downstream: blocking, antibodies, washing, detection |
| Blank membrane | No protein transferred | Check the sandwich: the membrane must sit between the gel and the positive electrode |
| Faint lanes everywhere | Low load or incomplete transfer | Stain the gel to see how much protein stayed behind |
| Large proteins missing | Large proteins stayed in the gel | Leave methanol out of the transfer buffer, or transfer for longer |
| Small proteins missing | Small proteins passed through the membrane | Use a smaller-pore membrane, shorten the transfer |
| Blank spots or patches | Air bubbles between gel and membrane | Roll out bubbles when you build the sandwich |
| Lanes of different intensity | Uneven loading | Normalize to total protein using the Ponceau image |
What a Ponceau S stain of the membrane tells you about the transfer, and what to try next.
Two transfer settings cause many of these patterns. Methanol in the transfer buffer helps proteins bind the membrane but can hold back proteins larger than about 100 kDa, so leave it out when you are blotting for large proteins. At the other end, proteins under about 20 kDa bind poorly to 0.45 µm membranes and can pass straight through, so use a smaller pore size for small targets (ref 2). Transfer time cuts both ways: too short leaves protein in the gel, too long pushes it through the membrane (ref 2).
The Ponceau image is also worth keeping. Imaged before you block, it is a total protein stain of the same lanes, which you can use as the loading control for total protein normalization.
High background
High background is one of the most common western blot problems, and it usually has one of a short list of causes. The usual one is too much antibody: a primary or secondary at too high a concentration binds the membrane as well as the target. Old or contaminated buffers, too little washing and too long an exposure all add to it (ref 1). Blocking matters in both directions. In one systematic test, blocking for 30 minutes or less gave unacceptably high background, while blocking for longer than 1.5 hours started to reduce the signal (ref 2).
Start by diluting the primary and secondary antibodies and adding wash steps, with Tween-20 in the wash buffer. Block for an hour, then change the blocking agent if background is still high. Milk contains casein, a phosphoprotein, so use BSA instead of milk with phospho-specific antibodies and with biotin-based detection (ref 1). If you use PVDF, expect more background than on nitrocellulose and wash thoroughly (refs 1, 2).
Blotchy, speckled or dirty backgrounds usually come from uneven agitation, contaminated blocking agent or aggregated secondary antibody. Incubate and wash on a shaker, filter the blocking agent, and centrifuge or filter the secondary to remove aggregates (ref 1).
Can you still quantify it? Often, if the bands stand clear of the background. Background subtraction removes an even background, and a background that changes across the blot needs a method applied lane by lane. Phoretix 1D offers eight background subtraction methods, which you can set per lane and per channel, with a live preview of the corrected lane profile. The background subtraction guide explains which method suits which blot. If the background is as strong as the band, the number will be unreliable whatever method you use.
No bands or weak signal
When the ladder is visible but the target is not, work through the chain in order. Check the transfer with Ponceau. Check that the primary antibody is validated for western blotting, because some antibodies are not, and that the secondary matches the primary’s host species. Run a positive control, a lysate or purified protein known to contain the target, to tell a sample problem from an antibody problem (ref 1). Check your buffers too. Sodium azide inhibits horseradish peroxidase, so an HRP detection buffer that contains azide can wipe out the signal (refs 1, 2).
Weak bands have milder versions of the same causes: too little antibody or antigen, too much washing, a short exposure, or milk masking the antigen, in which case try BSA or less milk (ref 1). Increase the exposure, but stop before the strongest bands saturate.
Can you still quantify it? A faint band can be measured if it is clearly above the background. Phoretix 1D detects bands with sensitivity presets for strong or faint bands, and you can add a band the detection missed. Its noise reduction smooths the lane profile, which helps with faint bands close to the detection limit. If there is no band, there is nothing to measure, and the blot has to be run again.
Smeared bands
A smear down the lane, rather than a tight band, usually means one of three things. The protein has degraded: repeated freeze-thaw cycles and time at room temperature leave streaks in the gel, so keep samples cold, add protease inhibitors and avoid repeated freezing (ref 2). The gel ran at too high a voltage, which overheats it and blurs the bands (ref 1). Or air bubbles were trapped during transfer (ref 1).
Can you still quantify it? Rarely with confidence. A smear has no clear upper or lower edge, so any band boundary you set is a guess, and two people will set it differently. Fix the sample or the run and repeat the blot.
Extra bands or bands at the wrong size
Bands below the expected size are often degradation products, which run ahead of the intact protein because they are smaller (ref 2). Use fresh samples kept on ice. A band that sits too high can mean the protein was not fully denatured; reheating the sample can break up its quaternary structure (ref 1). Extra bands can also be isoforms or proteins with a similar epitope (ref 2), so check the antibody’s validation data and run controls that show which band is your target. How to read a western blot explains what each kind of extra band means and how to tell them apart.
Can you still quantify it? Yes, if the target band is fully separated from the others. Measure the band you have identified and leave the others out. If two bands overlap, their volumes cannot be separated reliably.
Smiling, curved or uneven bands
Bands that curve up at the edges of the gel, called a “smile”, are a distortion of the run. Too high a voltage can overheat the gel and distort the bands, so run at a lower voltage (ref 1). Bands that are not flat can also come from proteins moving through the gel too fast because the resistance is low, which you fix by matching the gel to the sample (ref 1).
Can you still quantify it? Usually, yes. The bands are still there, just not in straight lines. Phoretix 1D detects lanes that lean, bow or drift off vertical, and you can bend the lane boundaries by hand, one lane at a time or across the whole gel, to follow a distorted run. For molecular weight, a ladder at each side of the gel works as a pair of anchor points: Phoretix 1D joins them up so that the curve of the run is corrected when sizes are assigned. Our video on analyzing smiley and warped gels shows a smiling gel rescued this way. If the image itself is rotated or flipped, Phoretix 1D can rotate, flip and crop it before analysis.
White bands, saturated bands and overloaded lanes
White or “negative” bands, where the band shows up lighter than the background, come from too much protein or too much antibody (ref 1). It is a sign of overloading.
Saturation is less obvious and more common. When a band reaches the top of the detector’s range, every pixel in it reads the maximum and the band stops getting brighter as protein increases. Pixel saturation is a common error in quantification (ref 2). Film saturates much sooner than a camera: in one comparison, film was linear over a 16-fold range of target protein, against 128-fold for a cooled camera imager (ref 3). Abundant proteins such as GAPDH saturate easily (ref 2).
Fix saturation at the imaging step: take a shorter exposure, and if a band still saturates at every exposure, load less protein or dilute the antibody. A dilution series shows you the load at which each antibody stays in its linear range (ref 3).
Can you still quantify it? Not the saturated band. The signal above the detector’s ceiling was never recorded, and no software can bring it back. The fix is to re-image, and if that does not work, to re-run. Phoretix 1D paints saturated pixels orange on the image so you can see which bands are affected before you measure. The western blot densitometry guide covers saturation and the linear range in detail.
Patches and spots
Patches and spots with missing or uneven signal usually come from the transfer. Air bubbles trapped between the gel and the membrane stop proteins reaching the membrane where they sit, so roll the sandwich out carefully when you assemble it (ref 1). Uneven agitation during incubation leaves patches too, as do antibodies binding the blocking agent and aggregated secondary antibody (ref 1).
Can you still quantify it? Only the lanes the patch does not touch. A bubble over a band removes protein that was never transferred, and background subtraction cannot restore it.
Troubleshooting a dot blot rather than a western blot? The blocking, antibody and detection problems are the same, and the dot blot troubleshooting section of our dot blot protocol covers the ones only spots have: rings, comet tails and spots that run together.
Can you still quantify it, or do you need to re-run?
Re-running a blot costs days, samples and antibody. Before you do, sort the problem into one of two groups.
Some problems are in the image, and the data underneath is still good. These include a smiling or warped run, lanes that lean, a background that is high or uneven but sits clear of the bands, faint bands above the noise, and an image that is rotated or inverted. Analysis software can handle all of these, as long as it applies the same correction to every lane and records what it did.
Other problems are in the data itself, and no software can fix them. These include saturated bands, no bands, smears, bubbles over the band of interest, and overlapping bands. These need a re-image or a re-run.
Phoretix 1D is built for the first group. It handles the following:
- Curved, bowed or leaning lanes: automatic lane detection, plus bending by hand per lane or across the whole gel.
- Smiling gels when sizing bands: ladders at each side of the gel act as anchor points for molecular weight.
- High or uneven background: eight background subtraction methods, set per lane and per channel, with a live preview.
- Faint bands: sensitivity presets for faint bands, noise reduction on the lane profile, and manual band addition.
- Inverted images: invert measurements in one step, with the display kept separate from the data.
- Rotated or flipped images: rotate, flip and crop before analysis.
It also flags the second group, painting saturated pixels orange, so you know before you report a number that cannot be trusted. Every setting is saved with the analysis and goes into the PDF report.
For the full workflow on a blot that ran well, see how to quantify a western blot, step by step.
The video below takes a deliberately poor blot image, inverted and with a background that is much brighter at the edges than in the center, and works through the background methods lane by lane until every lane gives a usable number.

Preventing the next problem
A few habits prevent most of the problems above:
- Measure protein concentration and load the same amount in every lane, inside the linear range of each antibody (refs 1, 3).
- Keep samples cold with protease inhibitors, and avoid repeated freeze-thaw cycles (ref 2).
- Make buffers fresh, keep sodium azide away from HRP detection, and store antibodies as the supplier recommends (refs 1, 2).
- Check every transfer with Ponceau before blocking (ref 2).
- Image at the longest exposure that leaves no band saturated, and keep the raw image file.
- Write down every change you make to the protocol, so that when a blot fails you can tell which step changed.
Before you re-run that blot, try quantifying it
Open a smiling, noisy or uneven blot in a free Phoretix 1D trial and see what you can still measure, with every correction recorded in the report.
Frequently asked questions
Q: How do I reduce high background on a western blot?
A: Dilute the primary and secondary antibodies first, then add wash steps with Tween-20 in the wash buffer, block for about an hour, and shorten the exposure. If background stays high, change the blocking agent: use BSA instead of milk for phospho-specific antibodies. PVDF membranes give more background than nitrocellulose and need thorough washing.
Q: Why are my western blot bands smeared?
A: The usual causes are degraded protein, a gel run at too high a voltage, or air bubbles during transfer. Keep samples cold with protease inhibitors, avoid repeated freeze-thaw cycles, lower the running voltage, and roll out bubbles when you assemble the transfer sandwich.
Q: Why is there no band on my western blot when the ladder is visible?
A: Check the transfer with a Ponceau S stain, then the antibodies: is the primary validated for western blotting, and does the secondary match its host species? Run a positive control to tell a sample problem from an antibody problem, and make sure no buffer used for HRP detection contains sodium azide.
Q: What does a Ponceau stain tell you about a western blot?
A: Whether the proteins reached the membrane. Even bands in every lane mean the transfer worked and the problem is downstream. A blank membrane, missing large or small proteins, faint lanes or blank spots each point to a specific transfer problem. The same image can also serve as a total protein loading control.
Q: Can I still quantify a western blot with high background or smiling bands?
A: Often, yes. An even or gradually changing background can be subtracted if the bands stand clear of it, and smiling or curved lanes can be followed by bending the lane boundaries. Saturated bands, smears and bands lost to bubbles cannot be recovered and need a re-image or a re-run.
Q: Do suppliers provide western blot troubleshooting guides?
A: Yes. Most antibody and reagent suppliers publish troubleshooting guides for their own products, and they are worth checking for antibody-specific advice. This guide is organized by what the problem looks like in your image, and it adds the question supplier guides rarely answer: whether you can still quantify the blot.
References
- Mahmood T, Yang PC. Western blot: technique, theory, and trouble shooting. N Am J Med Sci. 2012;4(9):429-34. doi:10.4103/1947-2714.100998
(Source for: the troubleshooting groups; causes of high background, no bands, weak signal, unexpected bands, blurry bands and patchy spots; sodium azide inhibiting HRP; BSA rather than milk for phospho-specific antibodies and biotin detection; PVDF background; reheating samples; white bands from too much protein or antibody; high voltage distorting bands; positive controls; membrane between gel and positive electrode.) - Bass JJ, Wilkinson DJ, Rankin D, Phillips BE, Szewczyk NJ, Smith K, Atherton PJ. An overview of technical considerations for Western blotting applications to physiological research. Scand J Med Sci Sports. 2017;27(1):4-25. doi:10.1111/sms.12702
(Source for: Ponceau and gel staining to check transfer; methanol and proteins over 100 kDa; small proteins and 0.45 µm membranes; transfer time; blocking time results; degradation products and streaks; isoforms and similar epitopes; pixel saturation as a common error; GAPDH saturating; PVDF background.) - Taylor SC, Berkelman T, Yadav G, Hammond M. A defined methodology for reliable quantification of Western blot data. Mol Biotechnol. 2013;55(3):217-26. doi:10.1007/s12033-013-9672-6
(Source for: film 16-fold against camera 128-fold linear range; dilution series to find the linear range.) - TotalLab. Phoretix 1D product page, background subtraction guide and tutorial videos
(Source for: lane detection and bending, dual-ladder anchoring, eight background methods per lane and per channel with live preview, noise reduction, band sensitivity presets, invert, saturation display, rotate, flip and crop, PDF report.)
Keep reading
All Phoretix 1D resources →- GuideTotal protein normalization for western blotsHow total protein normalization works, how stain-free, Ponceau S and fluorescent total protein stains compare, how to capture a valid total protein image, and how to normalize to total lane volume in Phoretix 1D.
- GuideWestern Blot Densitometry: How Band Quantification WorksWhat western blot densitometry measures, why saturation and the linear range matter, how background subtraction changes the result, the calculation from raw image to ratio to control, and how to report it in your methods.
- ComparisonHow to quantify a western blot in ImageJ, step by stepImageJ western blot quantification step by step, where the free tool gives different answers to different people, and how Phoretix 1D automates the same densitometry.
Phoretix 1DAutomated lane and band detection, densitometry and normalization for 1D gels and western blots.