
Case Studies: SameSpots 2D Gel Analysis Software in Leading Proteomics Labs
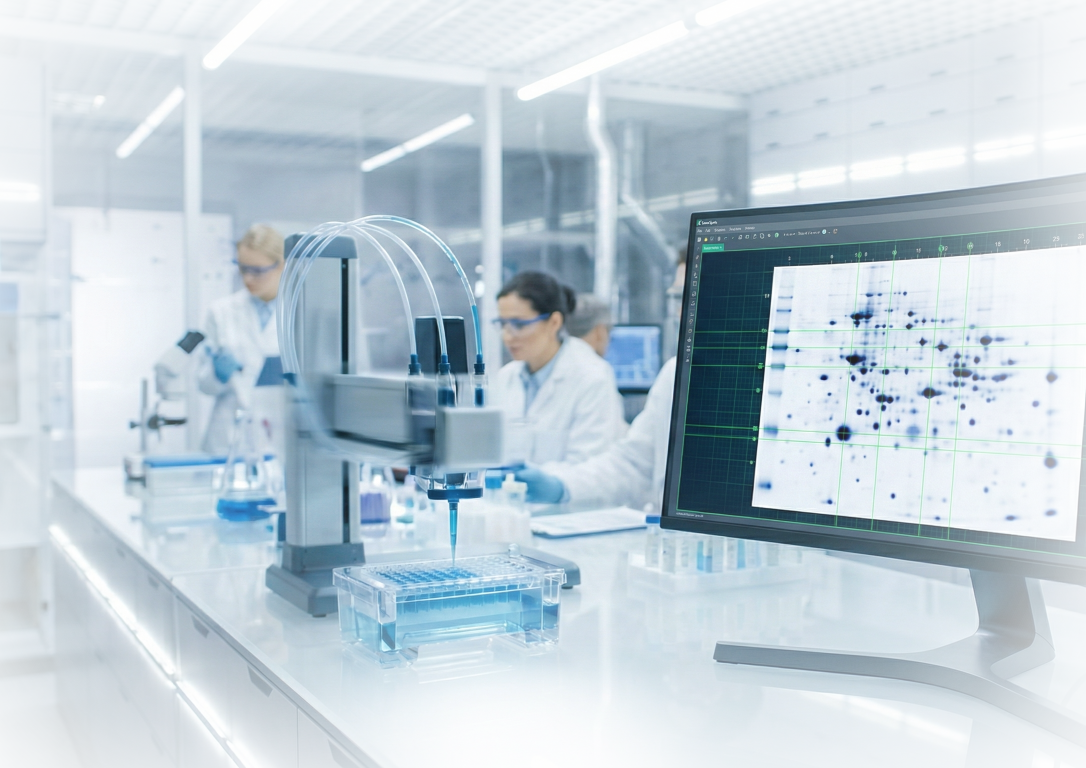
Scientists in high‑impact proteomics centres worldwide rely on SameSpots 2D gel analysis software to improve throughput, data quality, and statistical confidence in their protein expression studies.
These case studies highlight how academic, clinical, and government-funded facilities have streamlined 2D-PAGE and 2D-DIGE workflows, reduced manual spot editing, and generated more reliable biomarker data using the SameSpots platform.
University of Texas Medical Branch, Biomolecular Resource Facility
The Biomolecular Resource Facility at the University of Texas Medical Branch is one of only seven US sites to receive multi‑million‑dollar funding from the Department of Health & Human Services, supporting advanced proteomics research.
By combining SameSpots with saturation fluorescence strategies, the team enhanced confidence in protein quantification, strengthened their statistical analysis, and significantly increased throughput to save manpower and annual operating costs.
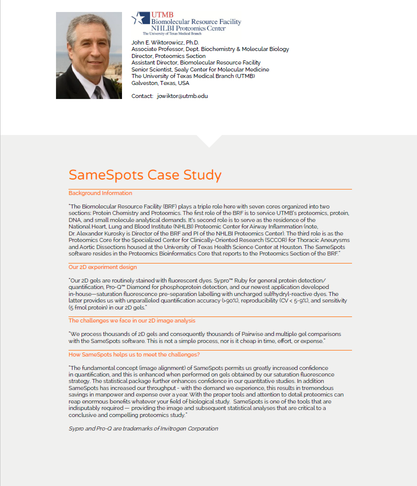
“The fundamental concept (image alignment) of SameSpots permits us greatly increased confidence in quantification, and this is enhanced when performed on gels obtained by our saturation fluorescence strategy. The statistical package further enhances confidence in our quantitative studies. In addition SameSpots has increased our throughput – with the demand we experience, this results in tremendous savings in manpower and expense over a year. With the proper tools and attention to detail proteomics can reap enormous benefits whatever your field of biological study. SameSpots is one of the tools that are indisputably required — providing the image and subsequent statistical analyses that are critical to a conclusive and compelling proteomics study.”
John E. Wiktorowicz, Ph.D. Associate Professor, Dept. Biochemistry & Molecular Biology Director, Proteomics Section
Key outcomes:
- Increased confidence in quantitative proteomics data through robust image alignment and statistics
- Higher throughput in 2D gel analysis, reducing manpower and expense
- More conclusive and compelling proteomics studies across diverse biological applications
Instituto di Ricerche Farmacologiche “Mario Negri”
The Environmental Health Sciences Department at the Instituto di Ricerche Farmacologiche “Mario Negri” uses SameSpots to study how environmental contaminants affect human health through proteomic biomarker analysis.
Since adopting SameSpots in 2007, the group has drastically simplified their proteomics workflow, aligning gels in around five minutes per gel and running fast, robust analyses with minimal manual correction.
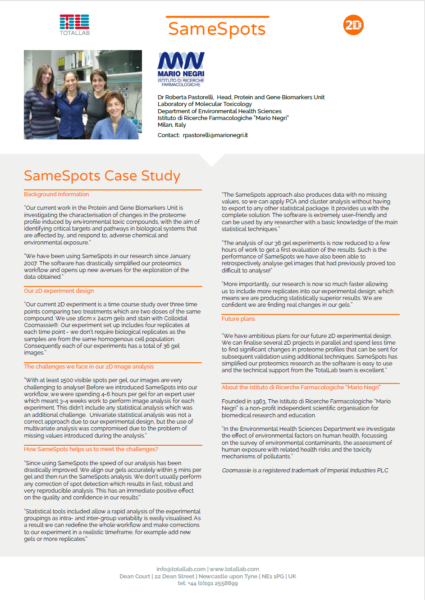
“We have been using SameSpots in our research since January 2007. The software has drastically simplified our proteomics workflow and opens up new avenues for the exploration of the data obtained”
“Since using SameSpots the speed of our analysis has been drastically improved. We align our gels accurately within 5 mins per gel and then run the SameSpots analysis. We don’t usually perform any correction of spot detection which results in fast, robust and very reproducible analysis. This has an immediate positive effect on the quality and confidence in our results.’’
Dr Roberta Pastorelli, Head, Protein and Gene Biomarkers Unit Laboratory of Molecular Toxicology
Key outcomes:
- Major reduction in analysis time and hands‑on intervention
- Fast, robust and highly reproducible gel analysis
- Improved confidence in results and the ability to explore new avenues in proteomics data
Cardiovascular Sciences Research Centre, St. George’s University of London
The Cardiovascular Sciences Research Centre at St. George’s University of London investigates mechanisms of cardiovascular disease using high‑resolution proteomics.
With SameSpots, the team can analyse 2D gels in hours rather than days, benefiting from excellent spot matching, minimal manual editing, and an intuitive statistics module that reports q‑values, p‑values and power in a clear workflow.
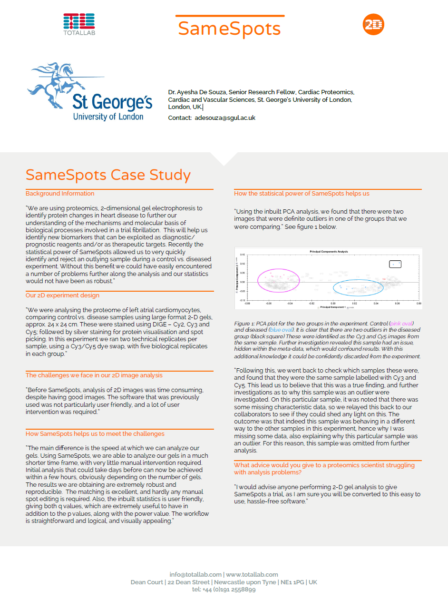
“The main difference is the speed at which we can analyze our gels. Using SameSpots, we are able to analyze our gels in a much shorter time frame, with very little manual intervention required. Initial analysis that could take days before can now be achieved within a few hours, obviously depending on the number of gels. The results we are obtaining are extremely robust and reproducible. The matching is excellent, and hardly any manual spot editing is required. Also, the inbuilt statistics is user friendly, giving both q values, which are extremely useful to have in addition to the p values, along with the power value. The workflow is straightforward and logical, and visually appealing.”
Dr. Ayesha De Souza, Senior Research Fellow, Cardiac Proteomics, Cardiac and Vascular Sciences, St. George’s University of London, London, UK.
Key outcomes:
- Dramatic reduction in gel analysis time with minimal manual intervention
- Extremely robust and reproducible results with high‑quality matching
- User‑friendly statistical reporting that supports confident biomarker discovery
Centre Paul Papin cancer research hospital
The Centre Paul Papin, a cancer treatment and research hospital collaborating with a regional proteomics platform, moved to SameSpots after struggling with previous 2D analysis software.
SameSpots resolved alignment issues, ensured that missing spots were detected and analyzed, and replaced laborious workflows with a more intuitive, biologist‑friendly interface and carefully designed statistical tools.
“With our previous software, we experienced three major problems. Firstly, despite the time we spent disposing of many landmarks on the master gel, the software made many mistakes in alignment. Secondly, when a spot was missing on the gel master, it was not detected and analysed. Finally, the software was not friendly to use and the analysis was laborious.”
“SameSpots is so convivial and intuitive that it is a real pleasure to work with. The image alignment step makes us feel secure that we have one hundred percent matching and the additional statistical tools are perfectly designed for biologists who are not specialized in statistics. The development and improvement of SameSpots has been pleasing.”
Prof Catherine Guette, Proteomics platform leader, Laboratoire d’oncopharmacologie, Nice, France
Key outcomes:
- Accurate image alignment with 100% matching confidence
- Reliable detection and analysis of all relevant protein spots
- Intuitive, “convivial” workflow tailored to non‑specialist biologists
Across cardiovascular, toxicology, environmental health and core proteomics facilities, SameSpots consistently delivers faster 2D gel analysis, better gel alignment, and more reproducible statistics that stand up to peer review.
To see how SameSpots can transform 2D-PAGE, DIGE and Western blot analysis in your own lab, request a free trial or speak with our team about deploying the software in your proteomics workflow.