
What HCP Antibody Coverage Percentage Is Acceptable?

There is no pharmacopeial threshold for anti-HCP antibody coverage. No USP general chapter sets a number, and industry roundtable notes record that regulators do not give one either. What exists instead is a set of method-specific norms that companies have built for themselves, and those norms differ by thirty percentage points depending on which method produced the figure. The same reagent, measured on the same material, has been published at 55 percent by one method and 92 percent by another.
So the useful question is not “what number is acceptable”. It is “which method produced this number, what was in the denominator, and how reproducibly was it measured”.
For the underlying definition and how host cell proteins arise, see what a host cell protein is. For why your ELISA and LC-MS totals disagree, see HCP ELISA vs LC-MS results.
Key facts
- Anti-HCP antibody coverage is the proportion of the host cell protein population that a polyclonal anti-HCP reagent recognizes. It qualifies the reagent used in an HCP ELISA. It is not a measure of how clean your process is.
- No pharmacopeial chapter sets a numeric coverage target. USP General Chapter <1132> describes how coverage is assessed and cautions that numerical coverage comparisons should be treated carefully because of method variability. It does not tell you what number to hit.
- Notes from the CASSS WCBP roundtable on host cell protein identification and monitoring record that there is “No ‘magic number’ from FDA with regard to coverage expectations (‘word on the street’ is 70% is sufficient)”, and that the interest is in coverage across all protein classes rather than a single percentage.
- A later CASSS WCBP roundtable on HCP assays records the norms the industry has built in the absence of a target: “50-70% for older more traditional 2D + Western blots”, “70-80% for AAE + 2D Silver stain”, and “80%+ for AAE + MS”. The same notes state that “Regulators don’t give a target coverage number, so companies have created their own norms.”
- Those bands are not three opinions about one number. They are three different measurements. Cygnus published 55 percent by 2D western blot, 73 percent by affinity antibody extraction with silver stain and 92 percent by affinity antibody extraction with a fluorescent stain, on the same CHO HCP material.
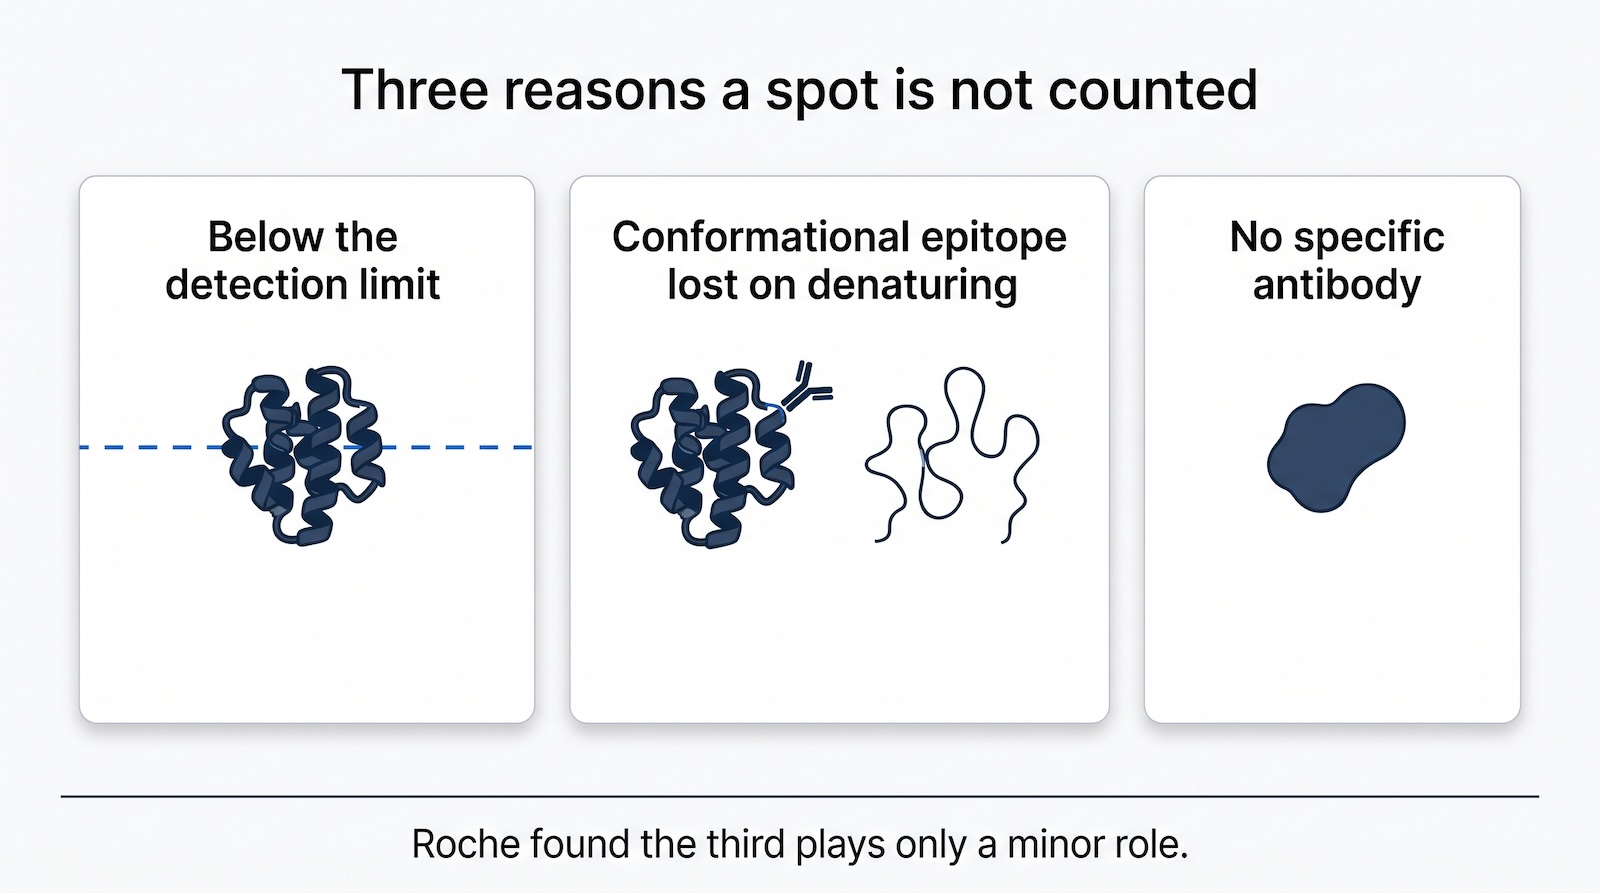
- A low 2D western blot figure can understate a good reagent. Roche tested this directly and attributed the apparent gaps mainly to amounts below the detection limit and to loss of conformational epitopes on denaturation, not to missing antibodies, concluding that “CHO-HCP ELISA antibodies are better than qualification studies by 2D-WBs indicate”.
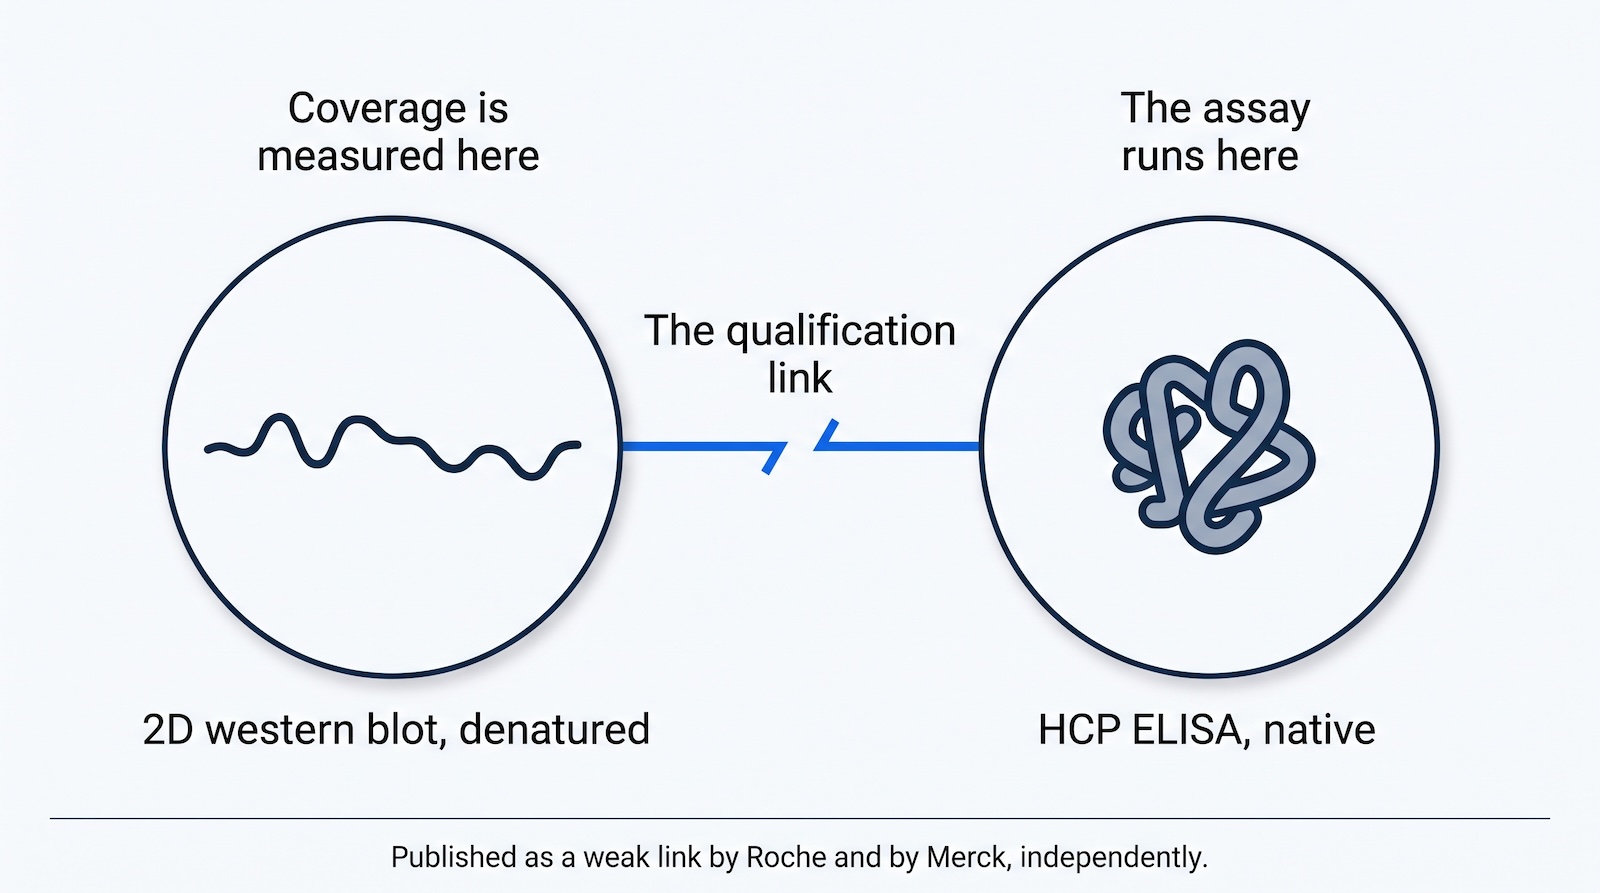
- The structural problem nobody can design away: the coverage method runs denatured, the ELISA it qualifies runs native. Merck put it plainly in print, calling the link “a rather weak link that is currently accepted”.
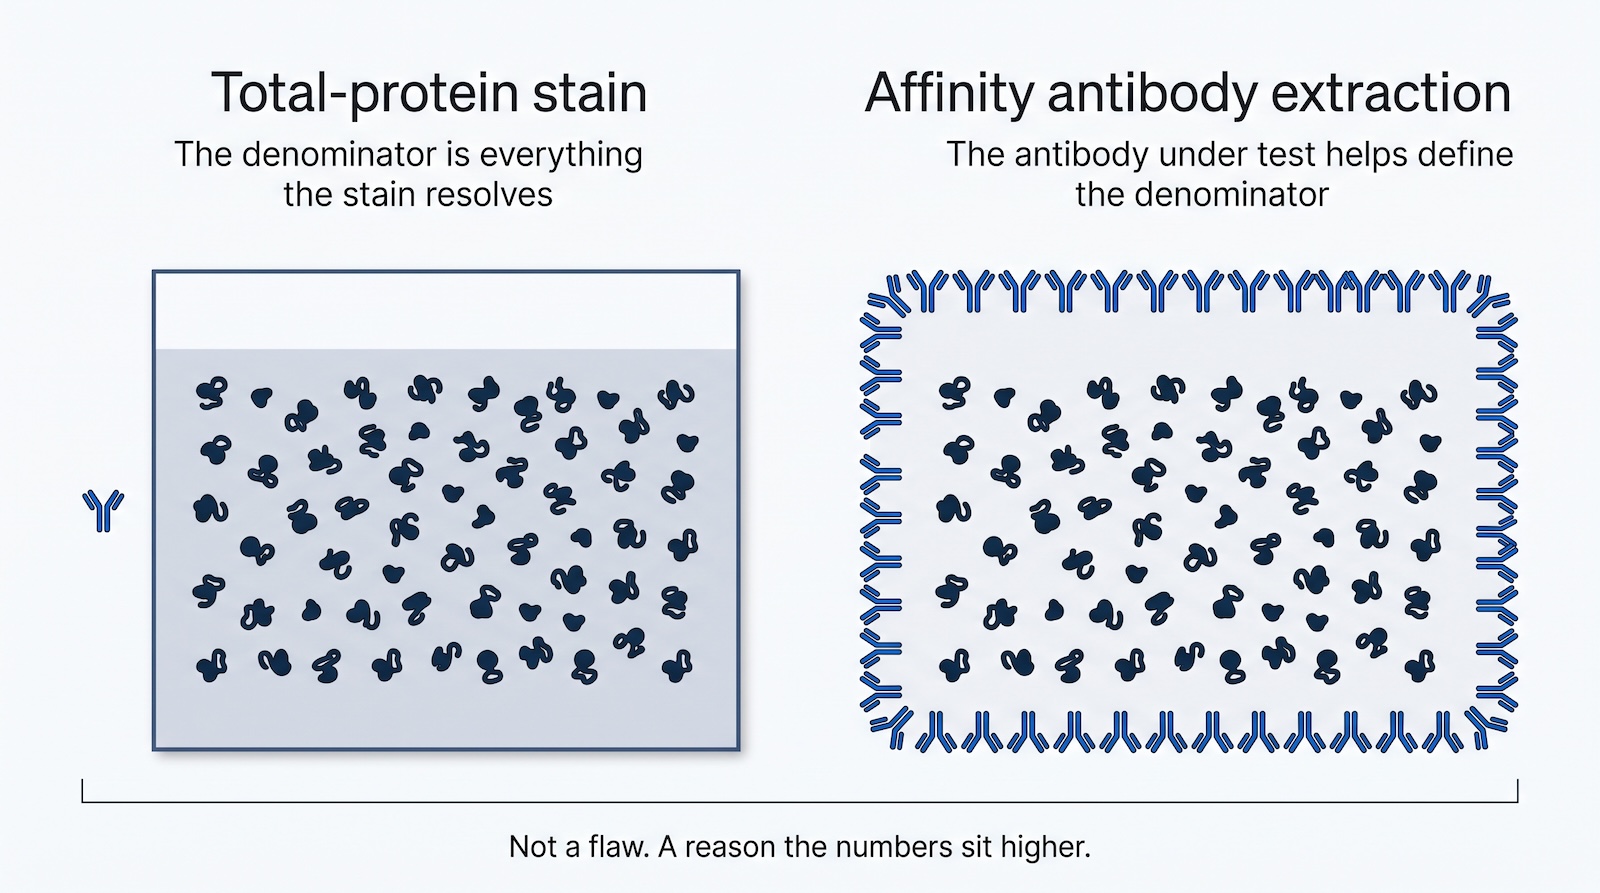
- Affinity antibody extraction raises the number partly because it removes the denaturation artifact and partly because the antibody under test helps define the denominator. USP General Chapter <1132.1> makes the related observation that immunoaffinity enrichment using the ELISA polyclonal is limited to the HCPs that antibody already binds, so it is not orthogonal to the ELISA.
What coverage actually measures
An HCP ELISA reports immunoreactive mass. It responds to the host cell proteins its polyclonal antibody happens to recognize, and it is blind to the rest. Coverage analysis is the experiment that tells you how large “the rest” is.
The classic form is a two-part comparison. Run the host cell protein preparation on a two-dimensional gel and stain for total protein. Run the same preparation, transfer it, and probe with the anti-HCP antibody. Count the spots the antibody detected, divide by the spots the stain resolved, and report the ratio.
Everything contentious about coverage lives in that division. The numerator depends on how sensitive your detection is and on whether the antibody can still recognize a protein after it has been denatured and transferred. The denominator depends on what your stain can see, and on whether the denominator was generated independently of the antibody or with its help.
Change any of those and the percentage changes, without anything about the antibody changing at all.
There is no pharmacopeial threshold, and that is a finding
People arrive at this question expecting a number to exist somewhere, in a chapter they have not read yet. It does not.
USP General Chapter <1132> is the immunoassay chapter. It sets out what coverage is and how to approach assessing it. It does not specify a percentage, and it warns that comparing coverage numbers between methods is not straightforward because the methods vary.
USP General Chapter <1132.1>, the LC-MS chapter that became official on 1 May 2025, is concerned with mass spectrometric quantitation rather than reagent qualification. It touches coverage only where immunoaffinity enrichment is discussed.
ICH Q6B expects acceptance criteria to be justified from your own data. It does not name a coverage figure either.
That absence is the single most useful fact on this page, and it is why every number you will be quoted comes with a vendor or a method attached.
The same antibody scored 55 percent and 92 percent
The clearest published demonstration comes from Cygnus Technologies’ own whitepaper on affinity antibody extraction. Three assessments of CHO host cell protein material:
| Coverage method | Reported coverage | What was counted |
|---|---|---|
| 2D western blot | 55% | "The goat anti-CHO antibody detected 717 spots out of 1293 spots (55%) found" (Cygnus AAE whitepaper) |
| AAE with 2D-PAGE, silver stain | 73% | "The affinity stripped CHO HCP material had a total of 827 proteins in common ... for a total coverage of 73%" (Cygnus AAE whitepaper) |
| AAE with 2D-PAGE, fluorescent stain (2D-DIGE) | 92% | "Based on this analysis 896 of the total 976 spots are found in both samples. This translates to a coverage of 92%" (Cygnus AAE whitepaper) |
| 2D western blot, affinity-purified antibody | More than 70% | Cygnus stated in-house experience, correlated to silver stain (Cygnus FAQ) |
| DIBE, E. coli HCP kit, three strains | 90% to 94% | Rockland Immunochemicals AccuSignal datafile |
| Conventional acceptance criterion | More than 50% of total HCP reactive | Stated as the traditional 2D western blot criterion (Cygnus; Zilberman, BioPharm International) |
Reported anti-HCP antibody coverage figures, with what was counted in each case. Figures as published by their sources.
Read the middle column and the spread stops being mysterious. The 2D western blot counted 717 detected spots against 1293 resolved spots. The affinity extraction with a fluorescent stain counted 896 spots in common out of 976. Different experiments, different denominators, one reagent.
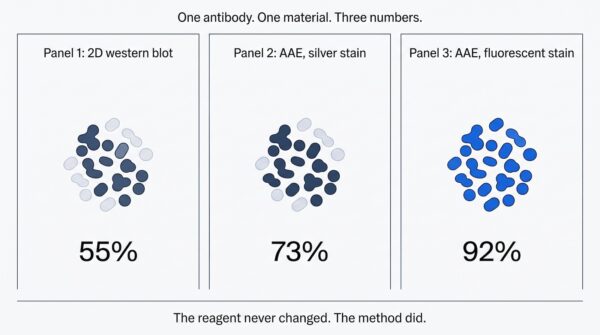
Cygnus published all three figures for one CHO HCP material. If a supplier quotes 92 percent and a customer quotes 55 percent, they may be describing the same reagent.
This is worth stating plainly because it is the fact that makes a bare percentage uninterpretable. If a supplier quotes you 92 percent and a customer quotes you 55 percent, you may be looking at the same antibody.
What each method reports, and why the numbers differ
| Coverage method | What is compared | What the denominator is | Industry norm band | Known bias | Best used for |
|---|---|---|---|---|---|
| 2D western blot against a total-protein stain | Spots on the blot against spots on the stained gel of the same sample | Every spot the stain resolves, defined without reference to the antibody | 50 to 70 percent | Understates the reagent. Roche attributed the gaps to protein or antibody amounts below the detection limit and to loss of conformational epitopes on denaturation, rather than to absent antibodies | A conservative, antibody-independent denominator, and for showing spread across pI and molecular weight |
| 2D-DIBE, two fluorescent channels on one gel or blot | Antibody-reactive channel against total-protein channel, same physical gel | Every spot the total-protein channel resolves | 90 to 94 percent reported on E. coli kits | Removes gel-to-gel alignment error, so it reports higher than a two-gel comparison of the same reagent. Still a denaturing method | Taking image alignment out of the argument |
| Affinity antibody extraction (AAE) with 2D-PAGE, silver stain | Proteins captured by an antibody column against the starting HCP material | Partly defined by the antibody under test, because the enrichment is done with that same antibody | 70 to 80 percent | Binding is native, so there is no denaturation artifact, but the enrichment step is not orthogonal to the ELISA it is qualifying | Coverage measured under binding conditions close to the ELISA itself |
| AAE with 2D-PAGE, fluorescent stain | As above, with a more sensitive stain | As above | Above the silver-stain band | Both the native-binding advantage and the non-orthogonality apply, and the more sensitive stain raises the spot count again | Showing how much of the gap was stain sensitivity rather than antibody |
| AAE or immunocapture with an MS readout | Proteins identified by MS in the captured fraction against proteins identified in the load | The MS-identifiable proteome of the load, which depends on the FASTA database and the false discovery rate setting | 80 percent and above | Produces the highest numbers of any method and is not comparable to a spot count. Sensitive to search settings | Naming which individual proteins are not covered, rather than producing a percentage |
| Capillary western (Simple Western) | A quantitative denatured and reduced capillary immunoassay against the 2D method | The proteins resolved by the 2D method | Not established | New, with little comparative data published. Merck's argument is that it removes the denatured-to-native mismatch because both methods run denatured and reduced | Linking the coverage method to a quantitative HCP number rather than a spot count |
Three things in that table decide most of the disagreement in the field.
The first is whether binding happens under native or denatured conditions. A 2D western blot denatures. An affinity column does not. Any protein whose epitope is conformational will be counted by one and missed by the other.
The second is the detection limit. A spot that is present but faint is not a coverage failure, it is a sensitivity limit, and it is counted against the antibody anyway.
The third is who defined the denominator. A total-protein stain resolves what it resolves, regardless of your reagent. An affinity extraction enriches using the antibody you are trying to qualify, so the antibody appears on both sides of the ratio. That is not a criticism of the technique, which has real advantages, but it is the reason its numbers sit higher.

What regulators have actually said
Two CASSS WCBP roundtable records are the most useful public evidence, because they capture what companies report being asked rather than what a vendor recommends.
The first records that there is no magic number from FDA on coverage expectations, and notes the informal industry figure of 70 percent circulating as “word on the street”. It also records that the interest is in coverage of all protein classes, across isoelectric point and molecular weight, rather than in one aggregate percentage.
The second records the self-generated norms quoted above, and states directly that regulators do not give a target number, so companies have created their own.
The practical translation: a percentage on its own answers a question nobody officially asked. A demonstration that your reagent detects proteins across the full pI and molecular weight range of your host cell proteome, with the method stated and the variability known, answers the question that is actually being asked.
Why a 2D western blot understates a good reagent
The strongest published work on this is from Roche. Seisenberger and colleagues set out to test whether low 2D western blot coverage values mean what people assume they mean, using orthogonal approaches including affinity-based mass spectrometry and indirect ELISA.
They identified two root causes for the apparent detection gaps: “(i) low amounts of proteins or antibodies being unable to overcome the detection limit and (ii) western blot artifacts due to the loss of conformational epitopes through protein denaturation hindering HCP-antibody recognition”.
They also tested, and largely dismissed, the explanation most people reach for first, reporting that “the lack of specific antibodies against certain (particularly, low molecular weight) HCPs, as proposed in previous studies, seems to play only a minor role”.
Their conclusion is the sentence to carry into any discussion of a disappointing coverage number: “CHO-HCP ELISA antibodies are better than qualification studies by 2D-WBs indicate”.
This does not mean a low figure can be waved away. It means a low figure is a prompt to find out which of the two causes is operating, and that is a question about detection limits and about which specific proteins were missed, not a question about the percentage.

The denatured-to-native mismatch, stated in print by Merck
Roche’s paper explains why the coverage number is pessimistic. Merck’s makes the more uncomfortable structural point.
Writing on capillary western methods for HCP in a Vero cell vaccine process, Gillespie and colleagues describe the standard qualification chain and then say what is wrong with it: the ELISA methodology requires 2D SDS PAGE and 2D western blot reagent validation to establish coverage, and “This reagent coverage provides a rather weak link that is currently accepted, as the western blot is run under denaturing conditions and the ELISA is run under native conditions.”
Their proposed fix is to change the readout rather than the argument. They note that with a capillary western, “the reagent coverage can be directly linked between the 2D methodology and Simple Western, as they are both run under denatured and reduced conditions”.
Whether or not you adopt capillary western, the admission underneath it matters. Two large manufacturers have independently published that the conventional coverage-to-ELISA link is weaker than its routine use suggests. That is the strongest possible argument against treating a single coverage percentage as a pass or fail specification, and it comes from the people running the assays, not from anyone selling an alternative.
So what number should you aim for?
If you need a working answer rather than a discussion, this is a defensible one.
Take the band that belongs to your method, not to someone else’s. If you are running a conventional 2D western blot, the recorded industry band is 50 to 70 percent. If you are running affinity antibody extraction with a silver stain, it is 70 to 80 percent. With an MS readout, 80 percent and above. Quoting an AAE-MS target at a 2D western blot laboratory is how a perfectly good reagent gets rejected.
Then do the three things that actually carry weight in a filing. State the method and the denominator every time the number appears. Show the distribution of detected and undetected spots across pI and molecular weight, because that is what the roundtable notes record regulators asking about. And identify the proteins you are not covering, because a reagent that misses ten abundant, inert proteins is in a different position from one that misses a single lipase.
What you should not do is move a reagent decision on a percentage produced by an undocumented method, or compare this year’s number to last year’s when the stain, the software or the operator changed in between.
What to state whenever you report a coverage percentage
| What to state alongside the number | Why it changes the number |
|---|---|
| The method, named exactly | A 2D western blot and an AAE silver-stain assessment of the same reagent sit in different industry bands. Cygnus published 55 percent and 73 percent on one material |
| The denominator, and whether the antibody under test helped define it | A total-protein stain counts every resolved spot. An affinity enrichment counts what the antibody captured, so the antibody is on both sides of the ratio |
| The stain and its sensitivity | Moving from silver to a fluorescent stain raised the same Cygnus comparison from 73 percent to 92 percent. Nothing about the antibody changed |
| The detection limit of the blot | Roche found that spots below the limit of detection, not missing antibodies, were a main cause of apparent non-coverage |
| Whether binding was native or denatured | The ELISA runs native. A 2D western runs denatured. Both Roche and Merck have published that this mismatch weakens the qualification link |
| Spread across pI and molecular weight, not just the total | Roundtable notes record regulators asking about coverage of all protein classes rather than a single percentage |
| The software, and its spot detection and matching rules | The count is produced by software. Two operators using different detection settings on one pair of images will not report the same percentage |
| The number of gels and operators behind the figure | A single-gel figure has no measure of its own variability and cannot support a trend across reagent lots |
Where the software comes in
Most of the variability in the list above is analytical, not biological. The spots are detected by software, matched between the stain image and the blot image by software, and counted by software. Two analysts working from one pair of images, using different detection sensitivities or different matching rules, will not report the same percentage.
That is the part of the problem that is fixable. Aligning the images before detecting spots, detecting one spot pattern across both images rather than detecting separately and matching afterwards, and keeping the detection parameters with the result, all remove sources of disagreement that have nothing to do with the antibody.
SpotMap 2D is TotalLab’s software for exactly this measurement: HCP antibody coverage analysis on 2D gels, 2D western blots, 2D-DIGE and 2D-DIBE. It exists because the coverage percentage is only as reproducible as the image analysis that produced it, and because a number you cannot reproduce is a number you cannot defend.
Run your own coverage analysis
The percentage is only as good as the image analysis behind it. SpotMap 2D aligns the gel and blot images first, then detects one spot pattern across the pair, so the count does not depend on matching two independently detected patterns afterwards.
Frequently asked questions
Q: What HCP antibody coverage percentage is acceptable?
A: There is no pharmacopeial or regulatory threshold. CASSS WCBP roundtable notes record that there is no magic number from FDA and that companies have created their own norms in its absence: roughly 50 to 70 percent for conventional 2D plus western blot, 70 to 80 percent for affinity antibody extraction with 2D silver stain, and 80 percent and above for affinity antibody extraction with a mass spectrometry readout. Use the band belonging to the method you actually ran, and report the method alongside the number.
Q: Is 70 percent the industry standard?
A: 70 percent is the figure that circulates informally, and CASSS roundtable notes capture it precisely that way, as “word on the street”. It is not a published requirement. It also sits at the boundary between two method bands, which is part of why it is quoted so often and disputed so often.
Q: Why did two labs report different coverage for the same antibody?
A: Almost certainly because they ran different methods. Cygnus published 55 percent, 73 percent and 92 percent for one CHO HCP material by 2D western blot, affinity extraction with silver stain, and affinity extraction with fluorescent stain. Before assuming a reagent problem, check the method, the stain, the detection limit and whether the denominator was generated with or without the antibody.
Q: Does low coverage mean my ELISA is missing HCPs?
A: Not necessarily, and Roche tested this specifically. They attributed most apparent gaps to amounts below the detection limit and to conformational epitopes lost on denaturation, rather than to absent antibodies, and concluded that CHO-HCP ELISA antibodies are better than 2D western blot qualification studies indicate. A low number is a reason to find out which proteins were missed and why, not an automatic reagent failure.
Q: Why is coverage measured under denaturing conditions when the ELISA is native?
A: Because 2D gel separation requires denaturation, and the 2D map is what makes a spot-by-spot comparison possible. Merck named this mismatch in print as “a rather weak link that is currently accepted”. The workarounds are to assess binding natively, using affinity antibody extraction, or to make both sides denatured by moving to a capillary western readout. Each fixes one problem and introduces another.
Q: Is affinity antibody extraction better than a 2D western blot?
A: It is better at some things. Binding is native, so conformational epitopes survive, and the reported numbers are higher and arguably closer to how the ELISA behaves. The trade is that the enrichment is performed with the antibody under test, so that antibody helps define the denominator. USP General Chapter <1132.1> makes the related point that immunoaffinity enrichment with the ELISA polyclonal is limited to what that antibody already binds, so it is not orthogonal to the ELISA. Run it knowing that, and report which one produced the number.
Q: Do regulators ask for 2D coverage data?
A: Roundtable notes record that they do ask about coverage, and that the emphasis is on coverage across all protein classes, spanning isoelectric point and molecular weight, rather than on a single aggregate percentage. A well-distributed 60 percent is a stronger submission than an 80 percent concentrated in one region of the gel.
Q: How do I make my coverage number reproducible?
A: Control the analytical layer. Align the gel and blot images before detecting spots, detect one spot pattern across the pair rather than detecting separately and matching afterwards, fix the detection parameters and store them with the result, and run enough replicates to know the variability of your own method. Then state the method, the denominator and the stain with every number you report.
References
- CASSS. WCBP Roundtable, Host Cell Proteins: Identification and Monitoring. Roundtable notes, 2023. https://www.casss.org/docs/default-source/wcbp/2023-roundtable-notes/host-cell-proteins-identification-and-monitoring.pdf (Source for: “No ‘magic number’ from FDA with regard to coverage expectations (‘word on the street’ is 70% is sufficient)”, and the emphasis on coverage of all protein classes rather than a single percentage.)
- CASSS. WCBP Roundtable Session 1, Table 13, Host Cell Protein Assays: Are We Still Relying on Conventional Quantification by Enzyme Linked Immunosorbent Assays (ELISAs)? Roundtable notes. https://www.casss.org/docs/default-source/wcbp/2026-roundtable-notes/host-cell-protein-assays–are-we-still-relying-on-conventional-quantification-by-enzyme-linked-immunosorbent-assays-(elisas).pdf (Source for: the three method bands, “50-70% for older more traditional 2D + Western blots”, “70-80% for AAE + 2D Silver stain”, “80%+ for AAE + MS”; and “Regulators don’t give a target coverage number, so companies have created their own norms.”)
- Seisenberger C, Graf T, Haindl M, Wegele H, Wiedmann M, Wohlrab S. Questioning coverage values determined by 2D western blots: A critical study on the characterization of anti-HCP ELISA reagents. Biotechnology and Bioengineering 2021;118(3):1116-1126. Published online 4 December 2020. DOI 10.1002/bit.27635. https://doi.org/10.1002/bit.27635 (Source for: the two root causes of detection gaps; the finding that missing antibodies play only a minor role; and the conclusion that CHO-HCP ELISA antibodies are better than 2D western blot qualification studies indicate. Retrieved via PubMed, PMID 33241851.)
- Gillespie PF, Wang Y, Yin K, Groegler E, Cunningham N, Stiving AQ, Raffaele J, Marusa N, Tubbs CM, Loughney JW, Winters MA, Rustandi RR. Automated, Quantitative Capillary Western Blots to Analyze Host Cell Proteins in COVID-19 Vaccine Produced in Vero Cell Line. Vaccines 2024;12(12):1373. DOI 10.3390/vaccines12121373. https://doi.org/10.3390/vaccines12121373 (Source for: the description of 2D western blot reagent coverage as “a rather weak link that is currently accepted, as the western blot is run under denaturing conditions and the ELISA is run under native conditions”, and the denatured-to-denatured argument for capillary western. Retrieved via PubMed, PMID 39772035.)
- Cygnus Technologies. Affinity antibody extraction (AAE) whitepaper and technical FAQ. (Source for: 717 of 1293 spots, 55 percent, by 2D western blot; 827 proteins in common, 73 percent, by AAE with silver stain; 896 of 976 spots, 92 percent, by AAE with fluorescent stain; and the stated in-house experience that a well generated and affinity purified antibody will react to more than 70 percent of individual HCPs by traditional 2D western blot correlated to silver stain.)
- Rockland Immunochemicals. AccuSignal E. coli HCP ELISA datafile. (Source for: 90 to 94 percent coverage by DIBE across three E. coli strains.)
- United States Pharmacopeial Convention. USP General Chapter <1132> Residual Host Cell Protein Measurement in Biopharmaceuticals. USP 39 and NF 34. https://www.usp.org/sites/default/files/usp/document/our-work/biologics/USPNF810G-GC-1132-2017-01.pdf (Source for: the treatment of coverage assessment and the caution about comparing coverage numbers across methods. Note that the free copy is the 2016 version.)
- United States Pharmacopeial Convention. USP General Chapter <1132.1> Residual Host Cell Protein Measurement in Biopharmaceuticals by Liquid Chromatography-Mass Spectrometry. USP-NF, official 1 May 2025. Subscription access. (Source for: the observation that immunoaffinity enrichment using the ELISA polyclonal is limited to the HCPs that antibody binds and is therefore not orthogonal to the ELISA. Paraphrased, not quoted; see the CONFIRM in Key facts.)