
Host Cell Protein (HCP) Analysis in Biologics: Methods, Challenges and Risk Management

Host cell protein analysis in biologics is the detection and quantification of process-related protein impurities, using orthogonal methods such as ELISA, 2D electrophoresis and LC-MS, to confirm that a drug substance is safe, stable and fit for regulatory submission. No single technique answers every question, so understanding what each method measures, and where each falls short, is the foundation of a defensible HCP strategy. This guide compares the three core analytical approaches and explains how to combine them.
(If you need the underlying biology first, see our primer on what host cell proteins are.)
Why host cell proteins matter in biopharmaceutical production
Host cell proteins (HCPs) are process-related impurities generated during the manufacture of biologics. Originating from expression systems such as CHO (Chinese Hamster Ovary) or E. coli, they can persist through downstream processing and affect the safety, efficacy and stability of the final product. HCPs are commonly released during harvest when host cells lyse, and some bind to and co-purify with the target molecule, the so-called “hitchhiker” HCPs that are especially difficult to remove.
Even trace HCP levels in a therapeutic can provoke immunogenic responses or degrade the drug substance, reducing efficacy and shelf life. For that reason, regulators including the FDA and EMA treat HCPs as a critical quality attribute (CQA), requiring monitoring throughout development and production. Crucially, recent research confirms that not all HCPs carry the same risk: one part per million of a benign HCP may be perfectly acceptable, while the same level of a proteolytic or immunogenic HCP may not be. Knowing the identity of your HCPs, not just the total load, is what makes acceptance limits defensible.
Analytical methods for host cell protein analysis in biologics
Three techniques dominate HCP analysis, each answering a different question. The table below summarizes how they compare.
| Method | What it measures | Key strengths | Key limitations | Regulatory role |
|---|---|---|---|---|
| HCP-ELISA | Total HCP concentration (ppm) | High-throughput, sensitive, routine; quantifies total HCP load | Reports only total HCP, not individual identities; results depend entirely on anti-HCP antibody coverage, which must be validated | Provides the quantitative HCP data required for FDA and EMA filings |
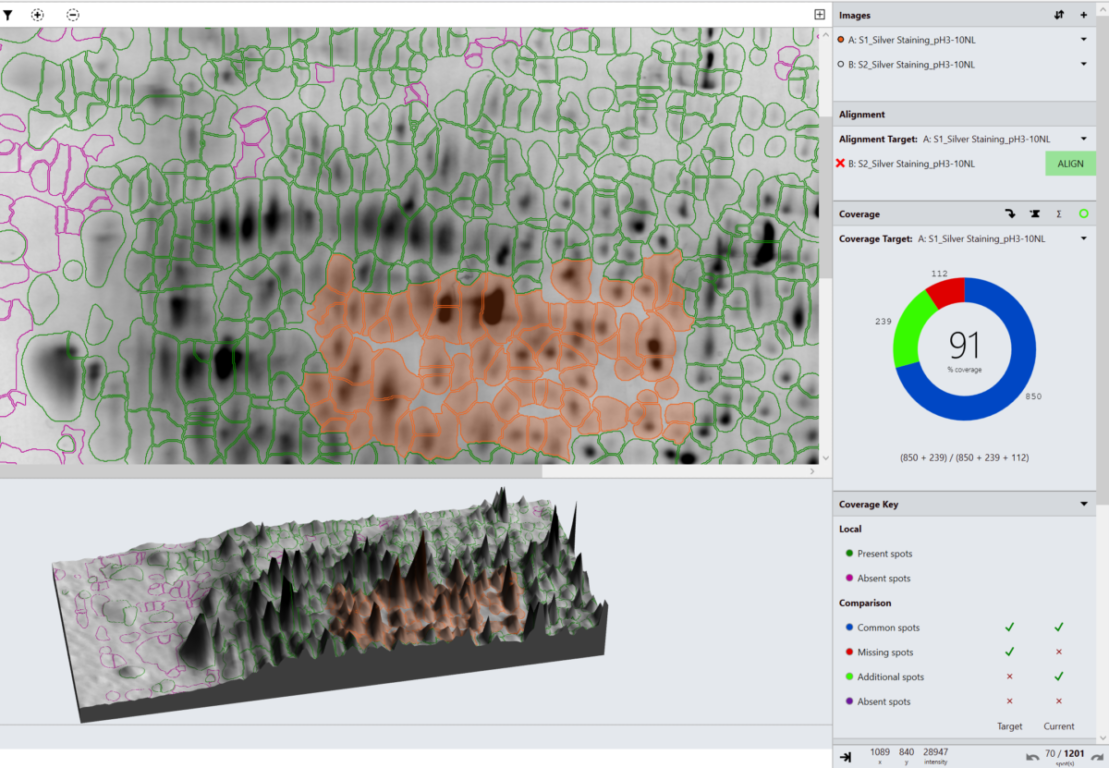
| 2D electrophoresis + Western blot (2D-PAGE, 2D-DIGE, 2D-DIBE) | A visual HCP profile and anti-HCP antibody coverage | Visualizes antibody specificity; validates ELISA coverage; ideal for bridging studies between reagent lots | Image-based, so prone to inter-operator variability when spot detection or alignment is done manually; traditionally slow | Supports the antibody-coverage validation regulators expect alongside ELISA |
| LC-MS (mass spectrometry) | The identity and abundance of individual HCPs | Detects and identifies low-abundance, individual HCPs; enables risk-based, per-HCP limits | Labor-intensive sample prep; difficult when HCP concentration is far below the drug substance; lower throughput | Increasingly expected for identifying and tracking high-risk individual HCPs |
HCP-ELISA
Enzyme-linked immunosorbent assay (ELISA) is the most widely used HCP technique and is applied across biotherapeutic production to quantify total HCP levels. The data is mandatory for regulatory filings. ELISAs are sensitive, high-throughput and easily automated for routine process control. Our PlateLogic ELISA analysis software automates the curve fitting and reporting so total HCP load can be tracked consistently batch to batch. The central caveat is coverage: an ELISA only reports a total concentration, and only for the HCPs its antibodies actually recognize, which is why coverage has to be validated independently.
2D electrophoresis and Western blotting
2D techniques (2D-PAGE, 2D-DIGE, 2D-DIBE) provide a visual profile of the HCP population and, critically, let you validate the antibody coverage underpinning your ELISA. They are the standard way to confirm that your anti-HCP antibody captures a broad enough range of the proteins actually present. Paired with SpotMap 2D, the coverage calculation that is normally slow and subjective becomes faster and reproducible, with audit trails aligned to 21 CFR Part 11 and GMP. For a worked example, see HCP coverage analysis using 2D Western blot.
LC-MS (mass spectrometry)
LC-MS resolves the limitation that ELISA cannot: it identifies and quantifies individual HCPs, including low-abundance species, which is what a modern risk-based strategy requires. SpotMap MS automates this characterization from LC-MS data using a data-independent acquisition (DIA) workflow, streamlining large-scale analysis across teams and sites. The trade-off is effort: sample preparation is demanding, particularly when the HCP concentration sits far below that of the monoclonal antibody or recombinant protein, and throughput is lower than ELISA. For how individual-HCP risk is surfaced, see how SpotMap MS identifies high-risk HCPs, and for a tool comparison, the LC-MS HCP software comparison.
Building an orthogonal HCP analysis strategy
Because each method has distinct strengths and blind spots, regulators and best practice both favor an orthogonal approach: combining techniques so the limitations of one are covered by another. In practice that usually means using ELISA for routine, high-throughput quantification of total HCP load, 2D electrophoresis to validate that the ELISA antibody coverage is adequate, and LC-MS to identify the specific HCPs present and flag any that are high risk. Used together, they let you state not just how much HCP remains, but which HCPs, and whether their levels are acceptable given their individual risk profiles. That combination is what turns a raw number into a defensible quality argument.
From end-of-batch testing to in-process risk management
The central challenge, now and into the future, is determining the level of each individual HCP accurately enough to act on it. Ideally that analysis would run during production, so impurities could be tracked and flagged as a batch progresses. In reality, several gold-standard techniques are too time-consuming for in-process use, so HCP analysis is largely performed at the end of production on finished material. The consequence is costly: if HCPs are found at unacceptable levels, the entire batch may have to be discarded.
As biologics grow more complex, the demand for precision and speed in HCP detection grows with them. Tooling that supports longitudinal data review, automates compliance reporting and enables collaborative, cross-site workflows is becoming indispensable to managing that complexity while meeting global regulatory expectations.
How TotalLab supports host cell protein analysis in biologics
TotalLab provides purpose-built, validated software for each method in an orthogonal HCP workflow: PlateLogic for ELISA quantification, SpotMap 2D for antibody coverage validation, and SpotMap MS for LC-MS identification and quantification of individual HCPs. Each enhances consistency between operators and accelerates analysis across teams. For regulated environments, AuditSafe adds a 21 CFR Part 11 and GMP compliance layer, and TrendLab supports the longitudinal trending that in-process risk management depends on. Method development teams aligning to compendial expectations may also find our note on USP 1132.1 and HCP software useful.
Frequently asked questions
What methods are used for host cell protein analysis in biologics? The three core methods are HCP-ELISA (for total HCP quantification), 2D electrophoresis with Western blotting (for antibody coverage validation and visual profiling), and LC-MS (for identifying and quantifying individual HCPs). Best practice is to combine them as orthogonal techniques.
Why is HCP analysis critical in biologics? Host cell proteins are process-related impurities that can trigger immunogenic responses, degrade the drug substance and reduce shelf life even at trace levels. The FDA and EMA classify HCPs as a critical quality attribute, so they must be monitored throughout development and manufacturing.
What is orthogonal HCP analysis? Orthogonal HCP analysis means using complementary techniques together so that the limitations of one are covered by another, for example using 2D electrophoresis to validate the antibody coverage of an ELISA, and LC-MS to identify the individual HCPs an ELISA cannot resolve.
Are host cell proteins a critical quality attribute? Yes. Regulatory agencies including the FDA and EMA classify HCPs as a critical quality attribute (CQA) because of their potential impact on patient safety, drug efficacy and product stability.
What is the difference between ELISA and LC-MS for HCP analysis? ELISA reports a single total HCP concentration and only for the proteins its antibodies recognize, so it cannot identify individual HCPs. LC-MS identifies and quantifies individual HCPs, including low-abundance species, which enables risk-based limits for specific proteins.
Why is HCP analysis usually performed at the end of production rather than in-process? Several gold-standard HCP methods require significant sample preparation and analysis time, which is not feasible during production. As a result, testing is typically done on finished material, meaning a batch found to contain unacceptable HCP levels may have to be discarded. Faster, in-process monitoring is an active goal for the field.
