
Experimental Design for 2D Gel and 2D-DIGE Studies

Most 2D gel experiments that fail do so before the first strip is rehydrated. A study with too few biological replicates, with controls run on one day and treated samples on another, or with every control labeled with the same dye, can produce a beautiful set of gels and still be unable to say anything defensible about the proteins that changed. Hunt and colleagues put it plainly in 2005: experiments often reveal proteins that appear differentially expressed, and those differences then fail to survive rigorous statistical analysis, a problem that is addressed through experimental design rather than more analysis. This article sets out how to design a 2D gel or 2D-DIGE study so that the statistics at the end have something to work with: which sources of variation you are up against, what a replicate is and how many you need, when pooling helps and when it hurts, how to lay out a DIGE experiment with an internal standard and dye swaps, and how to match the design to the test you will run.
Why experimental design decides the outcome
A 2D gel study is a measurement of protein abundance across a set of samples, and like any measurement it has noise. The purpose of experimental design is to make sure that the differences you care about are larger than the noise you cannot avoid, and that the noise you can avoid is kept out of the comparison altogether. Karp and Lilley’s 2007 review of design and analysis in quantitative proteomics makes the point that, independent of the technique used, whether DIGE, stained gels or mass spectrometry, the large datasets these studies produce need a robust design and a matching analysis before any conclusion is valid.
Three decisions carry most of the weight. The first is what counts as a replicate, because that determines what population your conclusion applies to. The second is how many replicates to run, because that determines the smallest change you can detect. The third is how the samples are arranged across gels, dyes, days and operators, because that determines whether a difference you find is due to the biology or to the arrangement. Everything else, including the choice of software, sits downstream of those three.
The three sources of variation in a 2D gel study
Variation in spot volume between two gels comes from three places, and they need different remedies.
Biological variation
Two animals, two patients or two cultures differ from each other even under identical treatment. This is the variation you are trying to see through, and it cannot be reduced by better technique; it can only be estimated, by running enough independent biological samples, and separated from the treatment effect by the statistical model.
Technical variation
Everything between the sample tube and the image adds noise: extraction and solubilization, protein assay, strip rehydration, focusing, equilibration, the second-dimension run, staining or labeling, and scanning. In conventional 2D gels this is dominated by gel-to-gel variation, which is why every sample runs on its own gel and why replicate gels of the same sample do not agree perfectly. In DIGE, the samples that share a gel share its technical variation, and the pooled internal standard corrects for the rest; Alban and colleagues showed in 2003 that including a standard made of equal amounts of every sample on each gel improved the accuracy of quantification across gels and allowed small differences to be detected.
Analytical variation
The image analysis itself adds variance, and more of it than most labs assume. Wheelock and Buckpitt tested two 2D gel packages on identical images and on real replicate sets, and found that simply shifting the crop boundary of an otherwise identical image changed the spot quantities, with a mean coefficient of variation of 8% in one package and 4% in the other. In authentic replicate gels the software-induced share reached as much as 25% of the total variance in the worse package, and omitting background subtraction altogether gave the least software-induced variance. Analytical variation is the one source you can reduce after the gels are run, by choosing software that measures every spot the same way on every gel and by keeping the analysis settings fixed across the experiment.
| Source of variation | Examples | Controlled by | Reduced by |
|---|---|---|---|
| Biological | Animal-to-animal, patient-to-patient, culture-to-culture differences | Statistical model with enough biological replicates | Cannot be reduced; must be estimated |
| Technical: sample preparation | Extraction efficiency, protein assay error, degradation | Standard protocol, single operator, one batch of reagents | Processing all samples together, in random order |
| Technical: separation | Strip lot, focusing, second-dimension run, gel casting | Running comparisons on the same day and gel batch; DIGE co-separation | Internal standard (DIGE); alignment (all 2D gels) |
| Technical: detection | Stain batch and timing, dye labeling efficiency, scanner settings | Fixed scan settings; dye swap in DIGE | Pooled internal standard; saturation-free imaging |
| Analytical | Spot boundary, background subtraction, crop area, matching errors | Same software, same settings, one spot pattern for every gel | Whole-experiment spot detection; no per-gel editing |
Biological, technical and pooled replicates
The word “replicate” covers three different things, and Karp and colleagues showed in 2005 that mixing them without saying so limits which statistical analyses can legitimately be run on the result.
A biological replicate is an independent biological unit: a different animal, patient, plant or independently grown culture. Biological replicates are the only kind that let you say the effect holds in the population you sampled from, because they are the only kind that capture biological variation.
A technical replicate is the same biological sample measured again: the same extract run on a second gel, or the same gel scanned twice. Technical replicates estimate the technical variance of the method. They tell you how repeatable your gels are; they tell you nothing about how variable the biology is, and they do not add independent evidence for a treatment effect.
A pooled replicate is a mixture of several biological samples run as one. Pooling averages out biological variation, which can make a treatment difference easier to see, but it also removes the information needed to estimate that variation, and a single pooled gel per group has no replication at all in the statistical sense. Pooling is discussed in its own section below.
The practical rule that follows from this is simple: count your biological replicates, treat technical replicates as a quality measure rather than as sample size, and do not average technical and biological replicates together as if they were the same thing. Three animals run on two gels each is an experiment with n = 3, not n = 6.
| Replicate type | What it is | What it estimates | Counts toward n? | Use it for |
|---|---|---|---|---|
| Biological | Independent animal, patient, plant or culture | Biological plus technical variation | Yes | Every comparison you want to generalize |
| Technical | Same sample, run or scanned again | Technical variation only | No | Method validation; checking gel reproducibility |
| Pooled | Several biological samples mixed and run as one | Neither; averages biological variation away | One pool = n of 1 | Scarce sample; preliminary screens; DIGE internal standard |
How many replicates do you need?
The honest answer is that it depends on three numbers: the smallest change you need to detect, the variance of your measurements, and the confidence you want. Hunt and colleagues built a design method for exactly the simplest case, two groups with variation at two levels (between samples and between gels), and showed how to choose both the number of samples and the number of gels per sample for a given minimum difference. Karp and Lilley did the equivalent for DIGE, measured the technical variance of a multi-gel experiment, found it reproducible within and across sample types, and ran a power study for the fold-change thresholds that researchers typically use, from which they give guidance on the number of gel replicates needed.
The logic of a power calculation is worth understanding even if the software does it for you. For a two-group comparison on log-transformed spot volumes, the number of biological replicates per group is approximately
n = 2 × (z_alpha + z_beta)² × s² / d²
where s is the standard deviation of log spot volume within a group, d is the difference in log volume you want to detect, z_alpha is 1.96 for a two-sided test at p = 0.05 and z_beta is 0.84 for 80% power.
Worked illustration. Suppose the standard deviation of log2 spot volume within a group is 0.5, which corresponds to a coefficient of variation of roughly 35%. To detect a twofold change (d = 1 on the log2 scale):
n = 2 × (1.96 + 0.84)² × 0.25 / 1 = 3.9, so 4 replicates per group.
To detect a 1.5-fold change (d = 0.58):
n = 2 × 7.84 × 0.25 / 0.34 = 11.5, so 12 replicates per group.
To detect a 1.2-fold change (d = 0.26):
n = 2 × 7.84 × 0.25 / 0.069 = 57, so 57 replicates per group.
The numbers are illustrative, because your variance will differ, but the shape of the result is general: halving the effect you want to detect roughly quadruples the sample size. This is why 2D gel studies that report 1.2-fold changes from three replicates per group are not believed, and why DIGE, which cuts the technical component of s, buys you smaller detectable changes for the same number of gels.
Two further points from the power literature. First, Karp and Lilley found that a two-dye Cy3/Cy5 design was more reproducible than the three-dye design, but that in studies comparing multiple samples the three-dye system with a Cy2 standard used fewer resources overall, so the extra channel pays for itself as experiments grow. Second, they showed that technical variance includes analytical noise and therefore depends on the software used, which means a power calculation done with one package’s variance does not transfer to another.
Note that the calculation above is for a single spot. A 2D gel experiment tests hundreds or thousands of spots at once, and the p-value threshold has to be corrected for that; our guide to p-values, FDR and q-values explains how, and SameSpots reports q-values alongside p-values so the correction is built in.
Pooling samples: when it helps and when it hurts
Pooling means combining protein from several biological samples into one tube and running the mixture as a single sample. It is tempting because it reduces the number of gels, and it is sometimes unavoidable because a single sample does not yield enough protein for a gel.
Pooling helps when the aim is to find candidate proteins rather than to prove a difference. A pool of six treated animals against a pool of six controls will show the large, consistent differences clearly and cheaply. It also helps when biological variation is very high relative to the effect, because averaging within the pool suppresses it.
Pooling hurts when you then treat the pool as if it carried the replication of its members. A single pooled gel per group has no estimate of variance, so no statistical test can be run, and an outlier sample in the pool can create or hide a difference with nothing to reveal it. Karp and colleagues’ 2005 analysis of replicate types is explicit that the analyses available depend on which replicate types are in the design; a design of pooled samples only supports conclusions about the pools, not about the individuals.
The sound compromise, where sample is limited, is several independent pools per group: for example, three pools of four animals each per group, giving n = 3 with reduced biological noise. Each pool is then a legitimate replicate of the pooling procedure, and a treatment effect can be tested.
There is one pool that every DIGE experiment should contain: the internal standard, made from equal amounts of every sample in the study. Its job is not to estimate biology but to give every gel the same reference, and it is covered next.
Designing a 2D-DIGE experiment
2D-DIGE lets up to three samples share a gel, which changes the design problem. If you are new to the method, our comparison of 2D-DIGE and 2D gel electrophoresis explains the chemistry; this section covers the layout.
Comparison of 2D-DIGE and 2D gel electrophoresis
Always include the pooled internal standard
Label a pool of equal amounts of every sample with Cy2 and run it on every gel. Every spot on every gel is then expressed as a ratio to the same reference, which removes gel-to-gel variation from the comparison across gels. Keeping and Collins found in 2011 that in DIGE data the decision to use an internal reference in the design had more effect on noise than the choice of normalization method, and that both normalization and standardization to the internal reference were needed to reduce variance as far as possible. In other words, the standard is a design decision, and no amount of analysis afterward substitutes for leaving it out.
Dye-swap to cancel dye bias
Cy3 and Cy5 do not label every protein identically, and a small number of spots show a consistent preference for one dye. If every control is labeled with Cy3 and every treated sample with Cy5, that dye bias is confounded with the treatment and appears as a false difference. The remedy is to swap: label half the controls with Cy3 and half with Cy5, and do the same for the treated samples, so that dye and treatment are balanced across the experiment. The Cytiva application note on DIGE experimental design describes each gel carrying the Cy2 standard plus two samples, and a balanced design is what makes the dye channel a nuisance factor rather than a confounder.
Randomize samples across gels
Do not put treated sample 1 with control 1 on gel 1, treated 2 with control 2 on gel 2, and so on, if samples 1 to 6 were collected in that order. Assign samples to gels and dyes at random, then check that each gel carries one sample from each group where the design allows it, so that gel is also balanced across treatment.
| Gel | Cy2 | Cy3 | Cy5 |
|---|---|---|---|
| 1 | Pooled standard | Control 4 | Treated 2 |
| 2 | Pooled standard | Treated 5 | Control 1 |
| 3 | Pooled standard | Control 6 | Treated 3 |
| 4 | Pooled standard | Treated 1 | Control 5 |
| 5 | Pooled standard | Control 2 | Treated 6 |
| 6 | Pooled standard | Treated 4 | Control 3 |
Gel count
With two experimental channels per gel, a DIGE study needs half the gels of a conventional design for the same number of samples: twelve samples on six gels rather than twelve. The Cytiva note gives the example of eight samples in triplicate on twelve gels rather than twenty-four. Karp and Lilley’s power study shows why that matters beyond cost: the internal standard removes most of the technical component of the variance, so each gel contributes more to statistical power than a conventional gel does.
Randomization and blocking
Two principles from classical experimental design do most of the work of keeping technical variation out of your comparison, and Karp and Lilley’s 2007 review, which highlights the importance of robust design and random allocation, treats them as part of the design rather than as refinements.
Randomization means that the order in which samples are prepared, focused, run and scanned is decided by chance and not by group. If all the controls are extracted on Monday and all the treated samples on Tuesday, then any difference between Monday and Tuesday (a fresh reagent, a warmer room, a different operator) becomes indistinguishable from the treatment. Randomizing the order spreads that day-to-day variation across both groups so that it inflates the noise, which the statistics can handle, rather than the signal, which they cannot.
Blocking means grouping the samples so that every comparison of interest is made within a set that shares its technical conditions. A DIGE gel is a natural block: the two samples on it share every step from rehydration to scanning, so a control-versus-treated pair on the same gel is compared under identical conditions. Strips from the same lot, gels cast in the same batch and runs on the same day are other blocks. The rule is to put one sample from each group in every block, and to record the block so that the analysis can account for it. Two-way ANOVA with block as the second factor, or a repeated measures design where the block is the subject, does exactly this.
What to write down before you start: for every sample, its group, its biological unit, the date and operator of each step, the strip and gel batch, the gel it ran on and (for DIGE) the dye. If a technical factor turns out to matter, this is the only way to find out.
Matching the design to the statistical test
The design and the test are the same decision seen from two ends. Decide the test first, and the design follows.
Between-subject designs compare independent groups: treated versus control, or three disease stages, with each biological replicate belonging to one group only. The test is one-way ANOVA (a t-test in the two-group case), and the number of biological replicates per group is the n in the power calculation above.
Two-factor designs vary two things at once, for example genotype and treatment, or treatment and time point with different animals at each time. The test is two-way ANOVA, which estimates each main effect and the interaction between them. Two-factor designs are efficient because every gel contributes to both questions, but they need balance: the same number of replicates in every cell.
Within-subject or repeated measures designs measure the same biological unit more than once: before and after treatment, or a time course on the same patients. The test is repeated measures ANOVA, which removes the between-subject variation from the comparison and is therefore more powerful for the same number of gels. The design requirement is that the samples from one subject are identifiable as such in the software, and that the technical blocks (for DIGE, the gels) do not line up with the time points.
SameSpots offers these three designs directly. You choose between-subject, within-subject or two-factor when you set up the experiment, and it applies one-way, repeated measures or two-way ANOVA accordingly, reports p-values, q-values and, for every spot, the power at the 0.05 level and the number of replicates that would reach 80% power, and gives you principal component analysis to check that the samples group as the design predicts. Because it aligns every image first and then detects a single spot pattern across the whole experiment, every spot has a value on every gel and the ANOVA runs on a complete dataset, which is what a balanced design assumes.
SameSpots 2D gel analysis software
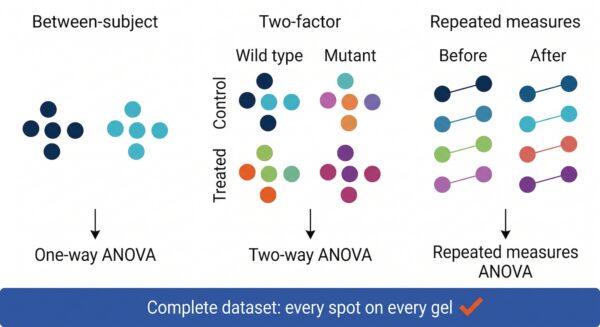
The design and the test are one decision. Choose between-subject, two-factor or repeated measures before the first gel is run, and the analysis follows.
A design checklist before you run a gel
- Write down the question as a comparison: which groups, which factor, what is the smallest change that would matter biologically.
- Decide the biological unit and count only those as replicates. Aim for at least four per group for twofold changes, and use a power calculation with your own variance for anything smaller.
- Decide whether to pool, and if so run several independent pools per group rather than one.
- For DIGE, include a Cy2 pooled internal standard on every gel and balance Cy3 and Cy5 across groups with a dye swap.
- Randomize the order of extraction, focusing, running and scanning across groups; do not process one group per day.
- Block where you can: one sample from each group on every DIGE gel, in every gel batch and on every run day, and record the blocks.
- Fix the imaging settings for the whole experiment and check that no spot is saturated; our guide to imaging 2D gels covers the settings.
- Choose the statistical design (between-subject, two-factor or repeated measures) before the first gel, so the layout supports it.
- Fix the analysis settings and use one spot pattern for every gel, so analytical variance does not vary by gel or by operator.
- Plan for multiple testing: decide in advance whether you will report q-values or a Bonferroni threshold, and at what cut-off.
Frequently asked questions
Q: How many biological replicates do I need for a 2D gel experiment?
A: It depends on the change you want to detect and the variance of your gels. With a within-group standard deviation of 0.5 on the log2 scale, about four biological replicates per group detect a twofold change at 80% power, about twelve detect a 1.5-fold change, and more than fifty are needed for a 1.2-fold change. Measure your own variance with a pilot and calculate rather than guess.
Q: What is the difference between a biological replicate and a technical replicate?
A: A biological replicate is an independent animal, patient, plant or culture. A technical replicate is the same sample run or measured again. Only biological replicates count toward sample size; technical replicates measure the repeatability of the method.
Q: Should I pool my samples for 2D gel electrophoresis?
A: Pool when sample is scarce or when you want a cheap first screen for large differences. Do not treat a single pool as a replicate of its members. If you must pool, run several independent pools per group so that a variance can be estimated.
Q: What is a dye swap in 2D-DIGE?
A: Labeling half of each group with Cy3 and half with Cy5, so that any protein that labels preferentially with one dye is not confounded with the treatment. Every DIGE design that compares two groups should be dye-swapped.
Q: Do I need an internal standard in a DIGE experiment?
A: Yes. A pooled internal standard labeled with Cy2 on every gel puts all the gels on the same scale and was found to have more effect on noise than the choice of normalization method. Leaving it out cannot be corrected afterward.
Q: How many gels does a DIGE experiment need?
A: Half as many as a conventional design for the same samples, because each gel carries two experimental samples plus the standard. Twelve samples need six gels; eight samples in triplicate need twelve gels rather than twenty-four.
Q: What is randomization in a proteomics experiment?
A: Deciding the order of sample preparation, gel runs and scans by chance rather than by group, so that day-to-day and batch-to-batch variation is spread across all groups instead of lining up with one of them.
Q: Which statistical test should I use for 2D gel data?
A: One-way ANOVA for independent groups, two-way ANOVA for two factors, repeated measures ANOVA when the same subjects are measured more than once, in every case followed by a multiple-testing correction such as the false discovery rate. SameSpots applies the right test from the design you choose, reports q-values, and its Power Analysis view shows how many replicates would bring 80% of your spots above 0.8 power.
Q: Does the analysis software affect how many replicates I need?
A: Yes. Software-induced variance can account for up to a quarter of the total variance in replicate gels, and power calculations use the total variance. Software that detects one spot pattern across every gel, with no per-gel editing, keeps the analytical component small and stable.
References
1. Hunt SM, Thomas MR, Sebastian LT, Pedersen SK, Harcourt RL, Sloane AJ, Wilkins MR. Optimal replication and the importance of experimental design for gel-based quantitative proteomics. J Proteome Res. 2005;4(3):809-19. https://doi.org/10.1021/pr049758y
(Source for: apparent differences failing rigorous statistics and design as the remedy; a method for choosing the number of samples and gels per sample for a minimum difference, in the two-group, two-level case.)
2. Karp NA, Lilley KS. Design and analysis issues in quantitative proteomics studies. Proteomics. 2007;7 Suppl 1:42-50. https://doi.org/10.1002/pmic.200700683
(Source for: robust design being required independent of technique; randomization and blocking; matching analysis to design.)
3. Karp NA, Spencer M, Lindsay H, O’Dell K, Lilley KS. Impact of replicate types on proteomic expression analysis. J Proteome Res. 2005;4(5):1867-71. https://doi.org/10.1021/pr050084g
(Source for: technical, biological and pooled replicates; mixing replicate types limits the statistical analyses that can be performed.)
4. Karp NA, Lilley KS. Maximising sensitivity for detecting changes in protein expression: experimental design using minimal CyDyes. Proteomics. 2005;5(12):3105-15. https://doi.org/10.1002/pmic.200500083
(Source for: technical variance reproducible within and across sample types; power study for typical fold-change thresholds and guidance on gel replicates; two-dye design more reproducible, three-dye using fewer resources for multi-sample studies; technical variance including analytical noise and depending on software.)
5. Wheelock AM, Buckpitt AR. Software-induced variance in two-dimensional gel electrophoresis image analysis. Electrophoresis. 2005;26(23):4508-20. https://doi.org/10.1002/elps.200500253
(Source for: crop-boundary shift inducing variance, mean CV 8% versus 4%; software-induced variance up to 25% of total in replicate gels; omitting background subtraction giving the least software-induced variance.)
6. Alban A, David SO, Bjorkesten L, Andersson C, Sloge E, Lewis S, Currie I. A novel experimental design for comparative two-dimensional gel analysis: two-dimensional difference gel electrophoresis incorporating a pooled internal standard. Proteomics. 2003;3(1):36-44. https://doi.org/10.1002/pmic.200390006
(Source for: the pooled internal standard of equal amounts of every sample on each gel improving accuracy across gels and allowing detection of small differences.)
7. Keeping AJ, Collins RA. Data variance and statistical significance in 2D-gel electrophoresis and DIGE experiments: comparison of the effects of normalization methods. J Proteome Res. 2011;10(3):1353-60. https://doi.org/10.1021/pr101080e
(Source for: the internal reference in the design having more effect on noise than the normalization method; both normalization and standardization to the reference needed to minimize variance.)
8. Cytiva (GE Healthcare). 2-D experimental design using Ettan DIGE system. Application note. https://cdn.cytivalifesciences.com/api/public/content/digi-13606-pdf
(Source for: each gel carrying the pooled standard and two samples; eight samples in triplicate on twelve gels rather than twenty-four.)
The power formula and worked illustration are standard two-sample calculations and are given for orientation; substitute your own variance estimate.
Run the design you planned, in SameSpots
Between-subject, two-factor or repeated measures: choose the design, and SameSpots runs the matching ANOVA on a dataset with no missing values, reports p-values, q-values and power for every spot, and shows you in a PCA plot whether the samples group the way the design predicts. Request a trial and analyze your own gels.