
How to Analyze 2D Gels: The SameSpots Workflow Step by Step
Analyzing a 2D gel experiment means turning a set of gel images into a short, statistically sound list of the proteins that changed. SameSpots does it in a fixed sequence of steps, each of which must be completed before the next opens. This guide walks through the sequence, with a short video for each step where one exists. If you are looking for the science rather than the software, start with our guide to 2D gel electrophoresis.
1. Image quality control
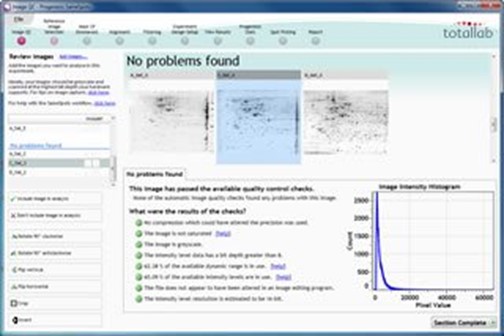
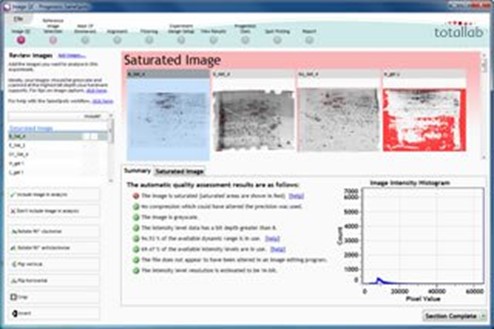
Every image is checked on import for bit depth, saturation, resolution and file-size consistency across the dataset, and for inversion or orientation problems. Anything that would compromise the analysis is flagged before you spend time on it. Cropping, rotating, flipping, scaling and inverting tools are built in so problems can be corrected without leaving the software.

2. Image alignment
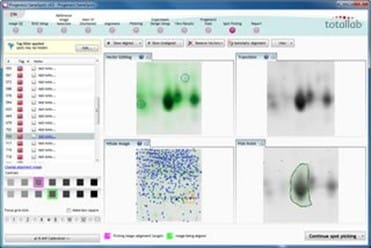
Choose a reference image and SameSpots aligns every other image to it at the pixel level, warping each gel so that its spots superimpose on the reference. Alignment is automatic; for difficult regions you can place alignment vectors by hand and the software refines from them. Alignment before detection is what allows one spot pattern to be applied to every gel, which is why there are no missing values later.
3. Automatic analysis
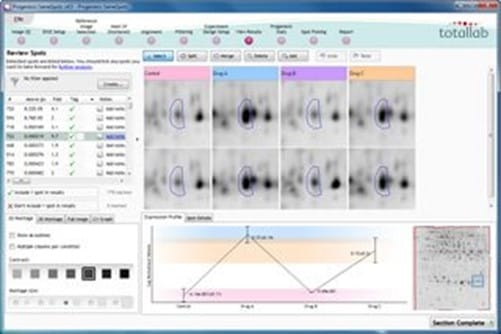
With the images aligned, one click runs spot detection, background subtraction, normalization and matching across the whole experiment. Because detection produces a single spot pattern, every spot has the same outline and the same ID on every gel. Spots are ordered by ANOVA p-value from the first run, so the candidates are at the top of the list before you have reviewed anything.
4. Review results
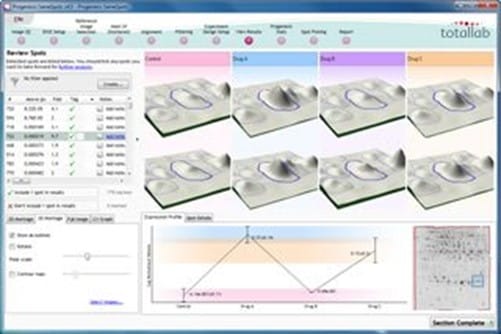
Review the detected spots with the tools you need to trust them: overlay of any gel on the reference, 3D view of any spot, expression profiles across groups, and a tag system for marking candidates. Edits to a spot outline are made once and propagate to every gel. Spots can be excluded, split or merged, and the statistics recalculate.
5. Statistical analysis
SameSpots runs the test that matches your experimental design: one-way ANOVA for independent groups, repeated measures ANOVA for within-subject designs, two-way ANOVA for two factors. SameSpots Stats adds principal component analysis, correlation analysis, power analysis, and q-values for false discovery rate control, so the shortlist you take to spot picking is one you can defend.

6. pI and molecular weight calibration
Mark known pI and molecular weight markers on the gel and SameSpots assigns an estimated pI and MW to every spot, recalculating on the fly as markers are added or moved.
SameSpots tutorial: how to assign pI and molecular weight to spots
7. Spot picking
Select the spots to identify, by tag, by statistics or by hand, and export a pick list in the format your spot picker expects, including the Cytiva Ettan Spot Picker, or as a generic coordinate list or a manual picking template with a numbered image.
8. Import protein IDs
Import identifications from Mascot or from a CSV export of any search engine, and SameSpots attaches each identity to its spot. The spot table then carries expression, statistics and identity together.

9. Publish and share
Build a report from the clip gallery: images, 3D views, expression profiles, statistics tables and identifications, exported for a paper, a presentation or a regulatory file. With AuditSafe, the report carries a full audit trail.
SpotCheck: the gel QC workflow
SpotCheck is a short workflow inside SameSpots for checking gel quality before a full analysis: the same alignment and detection engine, used to compare a new gel against a standard and report how well it ran. For worked results, including a 19-lab reproducibility study in which 18 labs produced gels that passed, see 2D gel quality control with SpotCheck.
Frequently asked questions
How do you analyze a 2D gel?
Check image quality, align every image to a reference, detect one spot pattern across the aligned set, review and normalize, run the statistics that match your experimental design, calibrate pI and molecular weight if needed, export a pick list for the spots that changed, and import the identifications. SameSpots runs those steps in that order.
How long does 2D gel analysis take in SameSpots?
Under five minutes per gel is typical. A full experiment of 24 images can be analyzed in approximately one hour.
Do I need to match spots between gels?
No. SameSpots aligns images before detection and applies one spot pattern to all of them, so there is no separate matching step and no missing values.
Can I edit spots?
Yes. Outlines can be edited, split, merged or excluded, and an edit made on one gel propagates to the same spot on every gel.
Which statistics are built in?
One-way, two-way and repeated measures ANOVA, principal component analysis, correlation analysis, power analysis, expression profiles and q-values for false discovery rate control.
Where are the tutorial videos?
Linked from each step on this page, and collected on the TotalLab YouTube channel.
Try the workflow on your own gels
Request a free SameSpots trial, import your images, and run the sequence above on your own experiment. Or read more about SameSpots 2D gel analysis software first.