
2D Gel Spot Detection and Quantification: How Spot Volume Works
A 2D gel image is a grid of pixel intensities. Spot detection turns that grid into a list of protein spots, and quantification turns each spot into a number that stands for how much protein it contains. Everything you conclude from a 2D gel experiment rests on those numbers, and how they are produced is neither obvious nor standardized: two packages given the same image can return spot volumes that differ by several percent, and the settings chosen for background subtraction alone can add or remove a measurable share of the variance in your data. This article explains what a spot is to the software, how spot volume is calculated, what background subtraction does and why it should be used with care, how overlapping spots and artifacts are handled, why detecting one spot pattern across an experiment is better than detecting on each gel, and what to check before you trust the numbers.
From pixels to spots: what detection does
To the software, a protein spot is a region of the image where intensity rises above the surrounding gel, peaks, and falls away again. Detection algorithms find those regions, decide where each one starts and stops, and assign each a boundary. Classical approaches include thresholding, where everything above a chosen intensity is a spot; watershed segmentation, which treats the inverted image as a landscape and lets each spot be a catchment basin; and model fitting, where a two-dimensional function such as a Gaussian is fitted to each peak and its parameters describe the spot. Dowsey and colleagues’ 2010 review of image analysis for expression proteomics surveys these methods and the wavelet and image-based approaches that succeeded them.
Whatever the algorithm, detection has parameters (a sensitivity or minimum contrast, a minimum spot size, a degree of smoothing) that decide how many spots are found. Set them too permissively and background noise and dust become spots; set them too strictly and faint proteins are missed. There is no universal correct setting, but there is a correct practice: choose the parameters once, on a representative image, and keep them fixed for the whole experiment, because a change in detection settings between gels is a change in what is being measured.
Spot volume, optical density and other measures
Once a spot has a boundary, several numbers can be read from it. Brauner and colleagues, who compared quantification methods in 2014, describe the main ones.
Spot volume is the sum of the pixel intensities inside the spot boundary. It is the standard measure of spot abundance, because it integrates all the signal from the protein regardless of how the spot is shaped, and it is what area-based methods report.
Optical density, sometimes called peak height, is the intensity of the most intense pixel in the spot. It is quick and unaffected by the exact boundary, but it ignores the spot’s spread, so a broad spot and a sharp spot of the same protein amount give different values.
Spot area is the number of pixels inside the boundary. It reflects how far the protein has spread rather than how much there is, and is rarely used for quantification on its own.
Fitted volume is the volume calculated from the parameters of a function fitted to the spot, for example the integral of a fitted two-dimensional Gaussian. Brauner and colleagues found that fitting was superior to the other approaches, and especially so when spots overlap, even when the bell-shaped function used was not a perfect description of the spot.
Normalized volume is the spot volume after correction for differences between gels in loading, staining and scanning; it is the number the statistics are run on and is the subject of our article on normalization.
| Measure | How it is calculated | Sensitive to | Best used for |
|---|---|---|---|
| Spot volume | Sum of pixel intensities inside the spot boundary | Boundary placement; background subtraction | Standard measure of protein amount |
| Optical density (peak height) | Intensity of the brightest pixel in the spot | Saturation; spot sharpness | Quick checks; not recommended for quantification |
| Spot area | Number of pixels inside the boundary | Detection sensitivity; focusing quality | Describing spot shape, not amount |
| Fitted volume | Integral of a function fitted to the spot, e.g., 2D Gaussian | Fit quality; model choice | Overlapping spots; precise quantification |
| Normalized volume | Spot volume corrected for gel-to-gel loading and imaging differences | Normalization method; internal standard | All statistics |
Two properties of spot volume matter in practice. It depends on the boundary: a boundary drawn one pixel wider on one gel than another adds a ring of low-intensity pixels to one measurement and not the other. And it depends on what is subtracted as background, which is the next section. Both are reasons why the boundary and the background should be defined the same way on every gel, and why the reproducibility of the software is a measurable quantity: Wheelock and Buckpitt showed that merely shifting the crop boundary of an identical image changed spot quantities with a mean coefficient of variation of 4% in one package and 8% in another.
Background subtraction
The gel around a spot is not black. Stain in the gel matrix, scanner offset and diffuse protein all contribute a baseline intensity, and if it is included in the spot volume, the volume of a small spot can be mostly background. Background subtraction estimates that baseline and removes it.
Common methods estimate the background for each spot from the lowest intensity on its boundary, from the average or the mode of the pixels just outside it, or from a smooth surface fitted under the whole gel (the “rolling ball” and related approaches), and subtract the estimate from every pixel inside the spot before summing.
Background subtraction is not free. Wheelock and Buckpitt tested every background subtraction and smoothing algorithm available in two packages, on identical images and on real replicate sets, and reported a result that surprises most users: the complete omission of background subtraction gave the least software-induced variance, and the use of background subtraction algorithms could increase it. The reason is that the background estimate is itself noisy, and subtracting a noisy estimate from a spot volume adds that noise to the result. Where the background is low and even, which is what a well-run, well-scanned gel should give, the correction removes little and adds noise; where the background is high and uneven, the correction is needed but the gel is the problem.
The practical rules that follow are: aim for gels and scans with a low, even background so that subtraction has little to do; use one background method with one setting for the whole experiment; and prefer a method that estimates background locally from each spot’s own surroundings, so that a gradient across the gel does not become a gradient in the spot volumes.
Overlapping spots and spot boundaries
Proteins do not arrange themselves for the convenience of software. Charge isoforms sit in horizontal trains, abundant proteins spread into their neighbors, and in crowded regions two or three proteins share a patch of gel. The software has to decide whether a region is one spot or several, and where the boundary between them runs.
Watershed-type segmentation splits a region at the saddle between two peaks, which works when the peaks are distinct and fails when one is a shoulder on the other. Model fitting handles this better: two overlapping Gaussians can be fitted jointly, and each spot’s volume is the integral of its own function rather than the pixels on one side of an arbitrary line. This is the case in which Brauner and colleagues found compound fitting most clearly superior, and it is also the case in which the choice of boundary has the largest effect on the volumes on either side of it.
Whatever the method, the important requirement is consistency: a pair of spots split on one gel and merged on another cannot be compared on either. Detecting a single spot pattern across the whole experiment, with the same boundaries applied to every aligned image, removes this failure mode entirely, because a boundary decision is made once and applies everywhere.
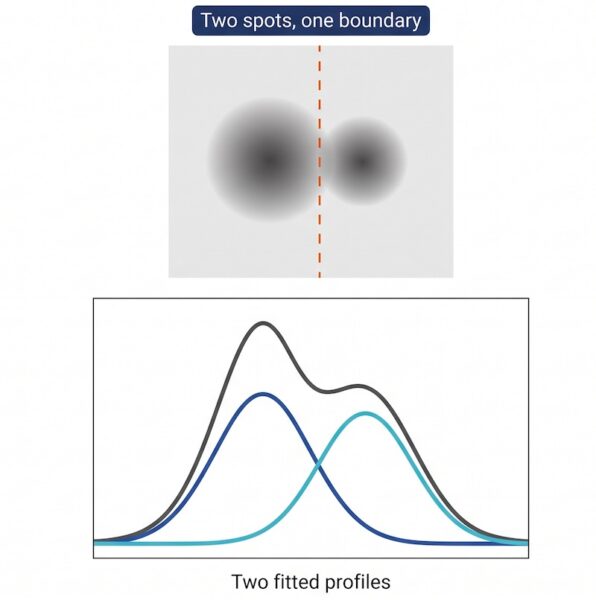
Where spots overlap, a fitted profile for each spot gives a better volume than a line drawn between them, and the split must be the same on every gel.
Saturation, resolution and the image itself
Quantification cannot recover what the image does not contain. Two properties of the image set the ceiling.
Saturation is the point at which a pixel reaches the maximum value the scanner can record. Any spot with saturated pixels has a volume that is too low by an unknown amount, because the true peak has been clipped, and a twofold change in an abundant protein can vanish entirely. Scan so that the most intense spot on the most intense gel is below saturation, and check for saturated pixels when images are imported; SameSpots checks bit depth and saturation automatically when images are added to an experiment.
Resolution and bit depth set how finely intensity and position are sampled. A 16-bit image records 65,536 intensity levels against 256 for 8-bit, and the difference is what allows faint and intense spots to be quantified in the same image. Our guide to imaging 2D gels covers the resolution, bit depth and scanner settings that give a quantifiable image, and it is the place to start if your spot volumes are noisier than your gels look.
Artifacts: streaks, dust and speckles
Not everything above background is protein. Detection has to be protected against the things that are not.
| Artifact | What it looks like | Cause | How to handle it |
|---|---|---|---|
| Horizontal streaks | Smears along the pI axis | Salt, incomplete focusing, protein overloading | Improve sample cleanup; exclude the streak region; do not count streak segments as spots |
| Vertical streaks | Smears along the MW axis | Poor equilibration, nucleic acids, dust on the strip | Optimize equilibration; nuclease treatment; flag affected spots |
| Dust and fibers | Small, sharp, very bright specks or lines | Particles on the gel or scanner glass | Clean before scanning; use a minimum spot size; remove by editing |
| Speckle from precipitated stain | Many tiny bright dots | Stain or silver precipitation | Filter stain; increase minimum spot size; smoothing |
| Bubbles | Round pale rings, sometimes with a bright rim | Air trapped during casting or staining | Exclude the region from analysis |
| Saturated spots | Flat-topped, clipped intensity profile | Scanner exposure too high | Rescan at lower exposure; flag the spot; do not quantify from saturated pixels |
| Gel edge and strip line | Bright band along the top or edge | Strip position, gel boundary | Crop consistently on every gel before detection |
The principle throughout is that the correction should be applied consistently, and that an artifact that affects one gel should be excluded from that gel’s measurements rather than allowed to appear as a change in protein abundance. Cropping deserves special mention: crop every image to the same region before detection, because, as noted above, the crop boundary itself affects the quantification.
One spot pattern for the whole experiment
There are two ways to run detection across an experiment. The traditional way runs it separately on every gel, producing a spot list per gel, and then matches those lists. The alternative aligns the images first, at the pixel level, and then runs detection once across the aligned set, producing a single spot pattern whose outlines are applied to every gel.
The difference for quantification is large. With per-gel detection, a spot that falls just below the sensitivity threshold on one gel has no volume there, a pair that splits on one gel and merges on another has no consistent volume anywhere, and a boundary drawn slightly differently on each gel adds variance to every comparison. Dowsey and colleagues describe these as the consequences of spot-centric approaches that discard information early and propagate errors. With one spot pattern, every spot has an outline on every gel, so every spot has a volume on every gel, the boundaries are identical by construction, and the statistics run on a complete dataset with no missing values.
This is how SameSpots works: it aligns every image to a reference, detects one spot pattern across the whole experiment, and applies it to every image. Our article on 2D gel image alignment explains the alignment step in detail.
Spot editing and when to do it
Automatic detection is good but not perfect, and every package allows spots to be added, deleted, split and merged by hand. The question is how much editing to do, and the answer is: as little as possible, and always for the whole experiment at once.
Editing is justified for clear errors: an artifact detected as a spot, a real spot missed because it lies at the sensitivity threshold, a pair that obviously needs splitting. It is not justified for making a spot look right on one gel, because a boundary that differs between gels is a source of variance rather than a correction. In a per-gel detection system this is the trap: an edit on gel 3 has to be repeated on gels 1, 2, 4 and so on, and in practice it is not, or not identically. In a single-pattern system an edit is made once and propagates to every gel, which is the only form of editing that keeps the measurement consistent.
Keep a record of what was edited and why. Where the analysis is regulated, that record is part of the audit trail; where it is not, it is still what allows a reviewer to tell a correction from a convenient adjustment.
What to check before you trust the numbers
- No saturated pixels in any spot you intend to quantify.
- The same crop region, detection parameters and background setting on every gel.
- Every spot has a volume on every gel, or the missing values are counted and understood.
- Spot boundaries fit the spots on every gel, not only on the reference; check the crowded regions.
- Artifacts have been excluded rather than detected as spots.
- Technical replicate gels, if you ran them, give spot volumes with a coefficient of variation that is consistent across the gel and in line with what the method should give.
- The total spot volume per gel is similar across gels; a gel with half the total of the others has a loading, staining or scanning problem that normalization will only partly hide.
- The editing log is short, and every entry has a reason.
Frequently asked questions
What is spot volume in 2D gel analysis?
The sum of the pixel intensities inside a spot’s boundary, usually after background subtraction. It is the standard measure of how much protein a spot contains and the quantity that is normalized and tested statistically.
What is the difference between spot volume and optical density?
Spot volume integrates the intensity of every pixel in the spot; optical density is the intensity of the single brightest pixel. Volume accounts for spot size and shape and is the better measure of protein amount; optical density is sensitive to saturation and spot sharpness.
Should I use background subtraction?
Use it with care. A study that tested all available background subtraction algorithms in two packages found that omitting background subtraction gave the least software-induced variance, because the background estimate adds its own noise. Aim for a low, even background on the gel, use one method and one setting for the whole experiment, and prefer local estimation.
How does software separate overlapping spots?
Segmentation methods split a region at the saddle between peaks; model-fitting methods fit a function to each spot jointly and take each spot’s volume from its own function. Fitting is more accurate when spots overlap. Either way, the split must be the same on every gel.
What causes missing values in 2D gel data?
Detecting spots on each gel separately. A spot that is detected on some gels and not others has no value where it was missed. Detecting one spot pattern across aligned images gives every spot a value on every gel.
What is a saturated spot?
A spot containing pixels at the scanner’s maximum value. Its true intensity is unknown and its volume is underestimated. Rescan at a lower exposure; do not quantify from saturated pixels.
How much spot editing is normal?
As little as possible. Edit for clear errors, edit for the whole experiment at once rather than gel by gel, and record every edit. Users of whole-experiment detection commonly report needing little or no correction of the automatic spot pattern.
Which software quantifies 2D gel spots automatically?
SameSpots from TotalLab aligns the images, detects one spot pattern across the whole experiment, quantifies every spot on every gel and runs the statistics, with spot editing that propagates to every image at once.
References
1. Brauner JM, Groemer TW, Stroebel A, Grosse-Holz S, Oberstein T, Wiltfang J, Kornhuber J, Maler JM. Spot quantification in two dimensional gel electrophoresis image analysis: comparison of different approaches and presentation of a novel compound fitting algorithm. BMC Bioinformatics. 2014;15:181. https://doi.org/10.1186/1471-2105-15-181
(Source for: definitions of area-based volume, optical density and fitted volume; fitting superior to other approaches, especially for overlapping spots, even with an imperfect bell-shaped function.)
2. Wheelock AM, Buckpitt AR. Software-induced variance in two-dimensional gel electrophoresis image analysis. Electrophoresis. 2005;26(23):4508-20. https://doi.org/10.1002/elps.200500253
(Source for: crop-boundary shift changing quantities with mean CV 4% versus 8%; omitting background subtraction giving the least software-induced variance; background subtraction able to increase variance; all available background and smoothing algorithms tested.)
3. Dowsey AW, English JA, Lisacek F, Morris JS, Yang GZ, Dunn MJ. Image analysis tools and emerging algorithms for expression proteomics. Proteomics. 2010;10(23):4226-57. https://doi.org/10.1002/pmic.200900635
(Source for: the 2D gel image analysis pipeline and detection methods; spot-centric approaches discarding information early and propagating errors.)
4. Görg A, Weiss W, Dunn MJ. Current two-dimensional electrophoresis technology for proteomics. Proteomics. 2004;4(12):3665-85. https://doi.org/10.1002/pmic.200401031
(Source for: causes of streaking and other gel artifacts.)
5. TotalLab. SameSpots 2D gel analysis software. https://totallab.com/software/2d-gel-analysis-software/
(Source for: automatic bit depth and saturation checks on import; one spot pattern across the experiment; edits propagating to every gel; customer reports of little or no correction being needed.)
The bit-depth figures (65,536 levels for 16-bit, 256 for 8-bit) are arithmetic. The artifact table is practitioner guidance drawn from reference 4 and TotalLab support experience.
Quantify every spot on every gel
SameSpots detects one spot pattern across your whole experiment, so every spot has a volume on every gel, every boundary is identical by construction, and an edit made once applies everywhere. Request a trial and run your own images.