
Normalization in 2D Gel and 2D-DIGE Analysis: Methods Compared

Load 10% more protein on one gel than another, or stain it for five minutes longer, or scan it at a slightly higher gain, and every spot on that gel is brighter, with no change in biology at all. Normalization is the step that removes these gel-wide differences so that the spot volumes on different gels can be compared. It sounds like housekeeping, and it is often treated as a checkbox, but the choice matters: Keeping and Collins showed in 2011 that although most methods reduce noise to a similar extent, the list of proteins found to be significantly different changed depending on which normalization was used. This article explains what normalization corrects, the methods in use for 2D gels and DIGE, what the two published comparisons found, why the internal standard in a DIGE experiment matters more than the arithmetic, and how to check that normalization has done its job.
What normalization corrects
Between two gels of the same sample, spot volumes differ for reasons that apply to the whole gel at once: the amount of protein loaded, the efficiency of transfer from strip to slab, the stain batch and staining time, dye labeling efficiency in DIGE, the scanner’s exposure or gain, and the background level of the image. Each of these scales, or shifts, every spot on the gel together. Kreil, Karp and Lilley, analyzing same-sample DIGE comparisons in 2004, observed strong fluctuations that showed up as large discrepancies between the distributions of spot intensities on different gels, and concluded that correct normalization was essential before gels could be pooled for analysis, with both dye-specific background levels and the differences in scale of the intensity distributions needing to be accounted for.
Normalization estimates the gel-wide factor from the data and divides it out. The result is a normalized volume for every spot, on a common scale across gels, from which the biological differences can be read.
What normalization cannot correct
Normalization removes effects that apply to the whole gel. It does not remove effects that vary from spot to spot or from region to region: a saturated spot, a streak through one part of the gel, a region that stained unevenly, a background gradient across the image, or a misaligned spot whose boundary catches a neighbor on one gel. Those need to be handled at the image stage; our article on spot detection and quantification covers them.
Article on spot detection and quantification
Nor does normalization substitute for experimental design. Keeping and Collins found in DIGE data that the decision to include an internal reference had a larger effect on noise than the choice of normalization method. A design that puts every control on Monday’s gels and every treated sample on Tuesday’s has confounded treatment with gel batch, and no normalization can separate them afterward. Our article on experimental design covers how to avoid this.
Normalization methods for 2D gels
The methods differ in what they assume stays constant between gels.
Total spot volume normalization assumes that the total amount of protein in all detected spots is the same on every gel, so each spot’s volume is divided by the gel’s total (or the total of the spots common to every gel) and expressed as a fraction or a percentage. It is the simplest and most widely used method. It is sound when most proteins do not change and when the same spots are detected on every gel; it is distorted when a few very abundant spots dominate the total and happen to change, or when a gel has spots that others lack.
Reference spot normalization assumes that one or more chosen spots, such as housekeeping proteins, are constant. Every spot is expressed relative to them. It depends entirely on the choice, and a reference protein that changes with treatment will shift every result in the opposite direction.
Median or robust scaling assumes that the median spot volume (or another robust central statistic) is constant across gels and scales each gel so that its median matches. It is less sensitive to a few abundant changing spots than total volume normalization.
Quantile normalization assumes that the whole distribution of spot volumes is the same on every gel, and forces each gel’s distribution to match a reference distribution rank by rank. It removes intensity-dependent effects as well as scale, at the cost of a strong assumption.
Intensity-dependent (loess, or “cyclic loess”) normalization assumes that the ratio between gels should not depend on spot intensity, fits a smooth curve to the ratio-versus-intensity plot and subtracts it. It was adopted from DNA microarray analysis. Kreil, Karp and Lilley showed that a variance-stabilizing transform developed for microarrays, combined with a robust Z-score, allowed gel-independent significance thresholds to be set for DIGE data where methods established in proteomics could not.
Internal standard normalization, specific to DIGE, expresses every spot as a ratio to the same spot in the pooled standard on the same gel, then normalizes those ratios across gels. It is covered in the next section.
| Method | Assumes constant between gels | Strengths | Weaknesses |
|---|---|---|---|
| Total spot volume | Total protein in all detected spots | Simple; widely used; no choices to make | Dominated by abundant spots; sensitive to which spots are detected on each gel |
| Reference spots | Chosen spots (e.g., housekeeping proteins) | Direct; interpretable | Fails if a reference protein changes; depends on a few measurements |
| Median or robust scaling | Median spot volume | Robust to a few large changes | Assumes most spots do not change |
| Quantile | The whole distribution of spot volumes | Removes intensity-dependent effects | Strong assumption; can suppress real global shifts |
| Intensity-dependent (loess) | Ratio between gels is independent of intensity | Corrects curvature in ratio-versus-intensity plots | Needs many spots; more complex; the related cyclic linear method performed worst in one comparison |
| Variance-stabilizing transform | Variance structure across intensity | Gel-independent thresholds; validated on same-sample DIGE data | Less familiar; requires appropriate software |
| Internal standard (DIGE) | The pooled standard is identical on every gel | Removes gel effects at source; largest single noise reduction | DIGE only; standard must be made and labeled consistently |
Normalization in 2D-DIGE: the internal standard
DIGE changes the normalization problem because up to three samples share a gel. Within a gel, the samples have already experienced the same run, the same transfer and the same scan, so what remains between them is dye labeling efficiency and dye-specific background, both of which are dealt with by within-gel normalization of the Cy3 and Cy5 channels to each other or to Cy2.
Between gels, the pooled internal standard does the work. Alban and colleagues introduced the design in 2003: a standard made of equal amounts of every sample in the experiment, labeled with Cy2 and run on every gel. Every spot in every sample is expressed as a ratio to the same spot in the standard on its own gel. Because the standard is the same material everywhere, that ratio is free of the gel’s own scale, and ratios from different gels can be compared directly. In a spiked E. coli experiment, Alban and colleagues found that the standard improved the accuracy of quantification between samples on different gels and allowed accurate detection of small differences in protein level.
Keeping and Collins went further in 2011 and quantified what each part contributes. They found that the decision to use an internal reference had a larger effect on noise than the choice of normalization method, and that both steps, normalization of the channels and standardization to the internal reference, were required to reduce variance as far as possible. A DIGE experiment run without a standard cannot be rescued by any normalization afterward; one run with a standard is forgiving of the method chosen.
Our comparison of 2D-DIGE and 2D gel electrophoresis explains the internal standard from the bench side.
Comparison of 2D-DIGE and 2D gel electrophoresis
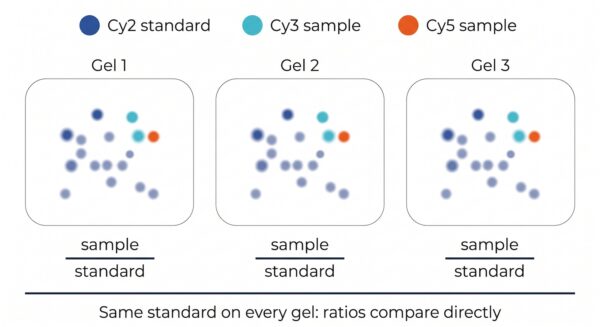
The pooled Cy2 standard is the same material on every gel, so a sample-to-standard ratio is free of the gel’s own scale and ratios from different gels compare directly.
What the published comparisons found
Two studies have compared normalization methods on real 2D gel data, and their findings are consistent.
Kreil, Karp and Lilley (2004) ran same-sample DIGE comparisons, in which any difference found is by definition noise, to measure how experimental variance affected differential expression analysis. They found large discrepancies between the intensity distributions of different gels, established that both dye-specific background and differences in scale had to be corrected, and showed that a microarray-derived variance-stabilizing transform with a robust Z-score gave significance thresholds that held up to cross-validation, where thresholds based on the methods then standard in proteomics did not.
Keeping and Collins (2011) compared eight normalization methods used for 2D gels and DIGE, on both noise reduction and on the list of significant proteins each produced. Their findings, in order of importance for a practitioner:
- Every method improved on unnormalized data. Not normalizing is the one clearly wrong choice.
- Cyclic linear normalization was the least well suited to gel data; the other methods reduced noise to a similar extent.
- In DIGE, the internal reference in the design reduced noise more than any choice among methods, and both normalization and standardization to the reference were needed for the maximum reduction.
- Despite similar noise reduction, the list of proteins found significantly different between groups changed with the method. Two labs analyzing the same gels with different normalization would publish different protein lists.
| Finding | Kreil, Karp and Lilley 2004 | Keeping and Collins 2011 |
|---|---|---|
| Data | Same-sample DIGE comparisons | 2D gel and DIGE experiments, eight methods |
| Unnormalized data | Large discrepancies between gel intensity distributions | All methods improve on it |
| What must be corrected | Dye-specific background and differences in scale | Channel normalization and standardization to the internal reference |
| Best performer | Variance-stabilizing transform with robust Z-score | Most methods similar; cyclic linear normalization worst |
| Effect of the internal standard | Not the question studied | Larger effect on noise than the choice of method |
| Effect on results | Gel-independent thresholds that survive cross-validation | Significant protein list changes with the method chosen |
The practical conclusion is that the method matters less than three other things: that you normalize at all, that in DIGE you have an internal standard, and that you use one method consistently and report which one, because the list of significant proteins is not independent of it.
Log transformation and why it comes first
Spot volumes are not symmetrically distributed. A twofold increase and a twofold decrease are the same size of change biologically, but on a linear scale one is +100% and the other is −50%, and the variance of spot volumes grows with their intensity. Taking the logarithm (usually log2 or log10) fixes both: fold changes become symmetric differences, and the variance becomes much more uniform across the intensity range, which is what the t-test and ANOVA assume. Karp and Lilley examined exactly these assumptions of normality and homogeneity of variance, which underlie the univariate tests routinely used on DIGE data, before running their power study.
The order matters. Ratios to the internal standard are formed on the linear scale, then logged; normalization across gels is then a shift on the log scale, which is a scaling on the linear scale. Statistics are run on the logged, normalized values. If your software reports “log normalized volume” or “standardized log abundance”, this is what it means.
How SameSpots normalizes
SameSpots normalizes spot volumes to correct for differences in loading, staining and imaging between gels, so that the statistics compare biology rather than gel handling. The method is a robust ratio-to-reference scaling, and it works the same way whether the reference is a gel or a DIGE internal standard.
Single-stain gels (2D-PAGE, 2D Western blots)
SameSpots first chooses a normalization reference gel automatically: it computes, for each candidate gel, the log ratios of every spot on every other gel to that candidate, and picks the gel for which those ratio distributions are tightest across the experiment. Then, for each other gel, it takes the ratio of each spot’s raw volume to the same spot’s raw volume on the reference, converts the ratios to log10, and finds their robust mean: an initial estimate from the median and median absolute deviation, limits set at three robust standard deviations either side, and the mean of the ratios inside those limits. Ratios outside the limits are treated as outliers and do not affect the result. The gel’s normalization factor is the single scaling that brings that mean log ratio to zero, and every spot volume on the gel is multiplied by it.
The assumption, stated in the software, is that a significant number of spots are unaffected by the experimental conditions, so that the factor by which the gel as a whole differs from the reference is a loading and imaging effect rather than a biological one. This is the same assumption behind median or robust scaling in the table above, applied on the log scale with explicit outlier limits, and it is far less sensitive to a few abundant changing spots than total-volume normalization is.
2D-DIGE gels
For DIGE, every Cy3 and Cy5 spot is first expressed as a ratio to the same spot in the Cy2 internal standard on the same gel, and the internal standard itself is set to one. Then a scaling factor is calculated for each sample image from the robust mean of its log10 ratios, in the same way as above, so that the log ratio distribution of each image is centered on zero. Both steps are automatic and the internal standard normalization cannot be switched off. This is exactly the two-step approach, standardization to the internal reference followed by normalization, that Keeping and Collins found necessary for the maximum reduction in variance.
What you can see and change
At the review step, SameSpots shows one graph per gel: each spot’s log volume ratio against the reference, ordered by mean volume, with the normalization factor and the robust estimation limits drawn on it, so a gel with a large factor or many outliers is obvious. The factors table can be copied out for your records. The spots used for the calculation are all spots that remain after filtering, so excluding artifacts at the filtering step changes the factors, and they are recalculated. A housekeeping option restricts the calculation to spots you have tagged as housekeeping proteins. For single-stain experiments, normalization can be switched off so that the statistics run on raw volumes, which is useful for checking how much the correction changed.
Because SameSpots aligns every image and then detects one spot pattern across the whole experiment, every spot has a volume on every gel, and normalization uses the same set of spots on every gel. That removes a weakness of methods in packages where the detected spot set differs from gel to gel. The statistics then run on log10 of the normalized volumes: one-way, two-way or repeated measures ANOVA according to the design, q-values from the p-value distribution, and, for every spot, a power value at the 0.05 significance level together with the number of replicates that would reach 80% power.
How to check that normalization worked
- Look at the normalization factor for each gel. Factors close to 1 mean the gels were loaded and scanned consistently; a factor far from the others marks a gel to inspect. Large factors are corrected, but they are also a warning.
- Plot the distribution of log normalized volumes for each gel side by side (a box plot). After normalization the medians should line up and the spreads should be similar.
- Plot the ratio between two replicate gels against average intensity (an MA plot). The cloud should be centered on zero across the whole intensity range; a tilt or a curve means an intensity-dependent effect that a scaling method has not removed.
- Run principal component analysis on the normalized data. Replicates should cluster by group; if they cluster by gel batch, run day or dye instead, the design has a problem that normalization did not solve.
- Check the coefficient of variation of technical replicates, if you have them, before and after normalization. It should fall, and it should fall for spots across the intensity range, not only the bright ones.
- Record the method and settings. The significant protein list depends on them, and a reader of your paper needs to know.
Frequently asked questions
What is normalization in 2D gel analysis?
The correction of spot volumes for differences that apply to a whole gel, such as protein loading, staining time and scanner settings, so that spot volumes from different gels can be compared. The result is a normalized volume for every spot on a common scale.
Why do 2D gel spot volumes need to be normalized?
Because two gels of the same sample give different raw volumes for every spot. Same-sample DIGE comparisons show large discrepancies between the intensity distributions of different gels; without normalization those discrepancies would appear as differential expression.
What is total spot volume normalization?
Each spot’s volume is divided by the total volume of all spots on the same gel, on the assumption that the total protein in the spots is the same on every gel. It is the simplest and most common method, and it is distorted when a few abundant spots change or when different spots are detected on different gels.
What is normalized spot volume?
A spot’s volume after the gel-wide correction has been applied, usually expressed relative to the total or to an internal standard, and usually log-transformed before statistics.
How does normalization work in 2D-DIGE?
Within each gel, the Cy3 and Cy5 channels are corrected for dye differences. Between gels, every spot is expressed as a ratio to the same spot in the Cy2 pooled internal standard on its own gel, and those ratios are normalized across gels. Using an internal standard reduces noise more than any choice of method.
Which normalization method is best for 2D gels?
A comparison of eight methods found that all improved on unnormalized data, that cyclic linear normalization was least suited to gel data, and that the others performed similarly on noise. Because the list of significant proteins depends on the method, the important thing is to use one method consistently and report it.
Should spot volumes be log-transformed?
Yes, before statistics. Log transformation makes fold changes symmetric and makes variance more uniform across intensities, which the t-test and ANOVA assume.
Can normalization fix a bad gel?
It can correct a gel that is uniformly lighter or darker. It cannot correct saturation, streaks, uneven staining, background gradients or misalignment, which vary across the gel; those are handled at the image stage or by excluding the gel.
How does SameSpots normalize spot volumes?
By robust ratio-to-reference scaling. Each spot’s volume is expressed as a ratio to the same spot on a reference (an automatically chosen reference gel, or the Cy2 internal standard on the same gel in DIGE), the log ratios are averaged with outliers excluded, and the gel is scaled so that the average is zero. The statistics then run on log-transformed normalized volumes.
References
1. Kreil DP, Karp NA, Lilley KS. DNA microarray normalization methods can remove bias from differential protein expression analysis of 2D difference gel electrophoresis results. Bioinformatics. 2004;20(13):2026-34. https://doi.org/10.1093/bioinformatics/bth193
(Source for: same-same comparisons; strong fluctuations and large discrepancies between spot intensity distributions of different gels; correct normalization essential for pooling gels; dye-specific background and differences in scale both needing correction; variance-stabilizing transform with robust Z-score giving gel-independent thresholds that held up to cross-validation where established proteomics methods did not.)
2. Keeping AJ, Collins RA. Data variance and statistical significance in 2D-gel electrophoresis and DIGE experiments: comparison of the effects of normalization methods. J Proteome Res. 2011;10(3):1353-60. https://doi.org/10.1021/pr101080e
(Source for: eight methods compared; all improve on unnormalized data; cyclic linear normalization least suited; other methods similar; internal reference having more effect on noise than method choice; both normalization and standardization required; significant protein list changing with method.)
3. Alban A, David SO, Bjorkesten L, Andersson C, Sloge E, Lewis S, Currie I. A novel experimental design for comparative two-dimensional gel analysis: two-dimensional difference gel electrophoresis incorporating a pooled internal standard. Proteomics. 2003;3(1):36-44. https://doi.org/10.1002/pmic.200390006
(Source for: the pooled internal standard design; equal amounts of every sample; spiked E. coli test; improved accuracy between gels and detection of small differences.)
4. Karp NA, Lilley KS. Maximising sensitivity for detecting changes in protein expression: experimental design using minimal CyDyes. Proteomics. 2005;5(12):3105-15. https://doi.org/10.1002/pmic.200500083
(Source for: assessment of the normality and homogeneity-of-variance assumptions behind univariate tests on DIGE data.)
5. TotalLab. SameSpots 2D gel analysis software. https://totallab.com/software/2d-gel-analysis-software/
(Source for: normalization at the review step; one spot pattern on every gel; statistics reported.)
The descriptions of total volume, reference spot, median,
quantile and loess normalization are standard definitions and
carry no numerical claims.
Normalize on a complete dataset
Because SameSpots measures every spot on every gel, normalization uses the same spots everywhere and the statistics run with no missing values. Choose your design, and p-values, q-values and power are reported for every spot. Request a trial and analyze your own gels.