
Western blot and gel analysis software compared: which tool gives you the same number every time?

Western blot analysis software turns a gel or blot image into band intensities, molecular weights and normalized ratios. The main options in 2026 are Phoretix 1D by TotalLab, ImageJ and Fiji, Bio-Rad Image Lab, LI-COR Empiria Studio and Image Studio, Cytiva ImageQuant TL, Thermo Fisher iBright Analysis Software, GelAnalyzer and the packages bundled with other imagers. This guide compares them on the questions that decide reproducibility: how lanes and bands are found, how background is removed, how normalization works, which imagers and file formats they accept, which operating systems they run on, and what a 21 CFR Part 11 edition costs you in flexibility.

What does western blot analysis software actually do?
Every package, free or paid, performs the same six steps: it finds the lanes, finds the bands, subtracts background, measures each band’s integrated intensity (the densitometry step), calibrates molecular weight against a ladder, and normalizes the target band to a loading control or to total lane protein. The differences are in who does each step, the user or the software, and in how many of those decisions are recorded so a second person can reproduce the result.
That is the whole comparison in one sentence. A free tool that leaves lane boxes, baselines and normalization formulas to the user is not wrong; it is just a different allocation of work, and it produces different numbers in different hands. Bundled imager software automates more of it but assumes every image in the lab came from that vendor’s instrument.

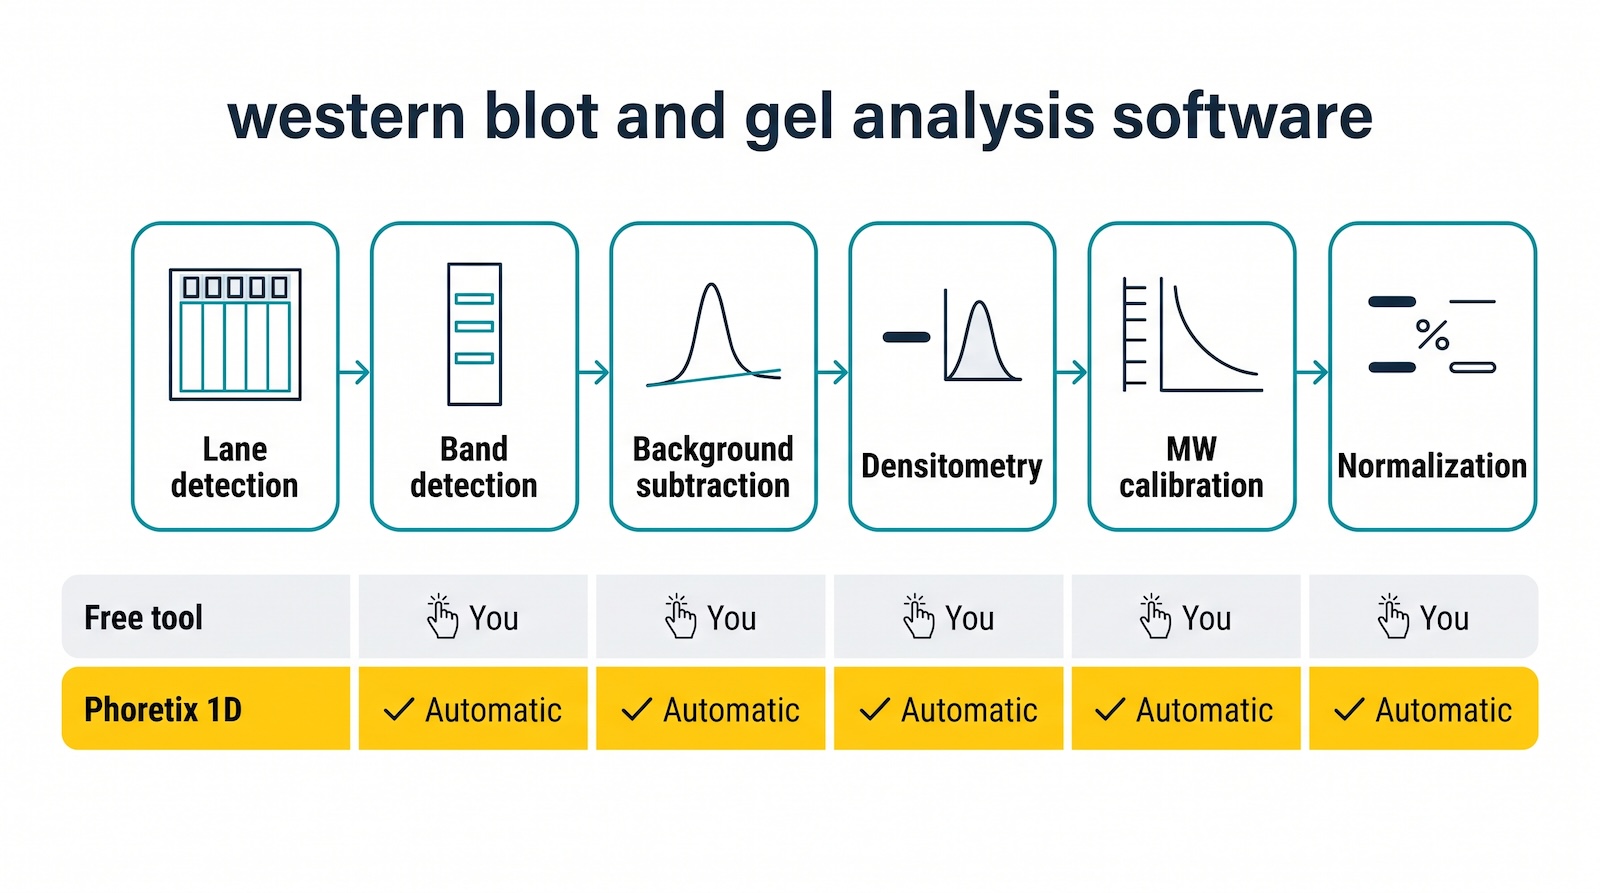
The eight options in one sentence each
- Phoretix 1D (TotalLab) is standalone 1D gel and western blot densitometry software that reads images from any imager, automates lane and band detection, background subtraction, MW calibration and normalization, runs on Windows, macOS, Linux and ARM, and adds 21 CFR Part 11 compliance through AuditSafe.
- ImageJ and Fiji (NIH, open source) are general image analysis programs whose Gel Analyzer function plots lane profiles for the user to baseline and integrate by hand, with results copied to a spreadsheet. Interestingly, members of the NIH actually are Phoretix 1D customers and use the software internally for their own work.
- Image Lab Software (Bio-Rad Laboratories) is the acquisition and analysis package for ChemiDoc and GelDoc imagers; the standard edition is a free download for Windows and Mac and the Security Edition for 21 CFR Part 11 is licensed and Windows only.
- Empiria Studio and Image Studio (LI-COR Biosciences) are the analysis packages for Odyssey imagers; Image Studio Lite was discontinued in 2021 and replaced by the commercial Empiria Studio, after which LI-COR reinstated Image Studio Software as a free download.
- ImageQuant TL, or IQTL (Cytiva) is the four-module analysis suite supplied for Amersham ImageQuant 800 and Typhoon imagers, available for Windows and macOS with a separate GxP edition for regulated labs.
- iBright Analysis Software (Thermo Fisher Scientific) is free desktop and cloud software for images captured on iBright systems, with a Secure edition for Part 11 support.
- GelAnalyzer is a free standalone 1D gel evaluation program used widely in academic labs. However, version 26.1.1 analyzes 8-bit images only and offers no normalization to a loading control, so quantitative western blot work soon outgrows it (see GelAnalyzer vs Phoretix 1D).
- AzureSpot Pro (Azure Biosystems) is the analysis package supplied with Azure imagers and was developed by TotalLab for Azure Biosystems, so Azure owners already use a TotalLab workflow; our guide for Azure imager owners covers what the standalone Phoretix 1D adds.
- Other OEM packages (Syngene GeneTools, Vilber Bio1D, Analytik Jena VisionWorks and the rest) ship with a specific imager and are covered in our guide to imager software versus independent software.
Comparison table
| Criterion | Phoretix 1D (TotalLab) | ImageJ / Fiji | Image Lab (Bio-Rad) | Empiria Studio / Image Studio (LI-COR) | ImageQuant TL (Cytiva) | iBright Analysis Software (Thermo Fisher) | GelAnalyzer |
|---|---|---|---|---|---|---|---|
| Price | Licensed per computer with unlimited users; support and updates included | Free and open source | Standard edition free; Security Edition licensed | Empiria Studio licensed; Image Studio free download | Licensed; trial available from Cytiva | Free desktop and cloud editions; Secure edition for Part 11 | Core program free; Plus tier €45 one-time, licensed to an individual |
| Images from any imager | Yes: TIFF (8-bit to 16-bit and above) and multiplex TIFF from any vendor plus IMG JPEG PNG BMP | Yes (any image) | Written for ChemiDoc and GelDoc files | Written for Odyssey files | Compatible with ImageQuant 800 and Typhoon; opens TIF | Described by Thermo as software for images captured on iBright systems; G2i plus TIFF | 8-bit images only (JPG, GIF, PNG, TIFF) |
| Automatic lane detection | Yes including distorted and empty lanes; multiple lane boxes per image | No (user draws a rectangle per lane) | Yes | Yes (see LI-COR documentation) | Yes | Yes | Yes |
| Automatic band detection | Yes with per-lane and per-channel parameters; manual add split remove | No (user sets baselines and selects peaks by hand) | Yes | Yes (see LI-COR documentation) | Yes | Yes | Yes |
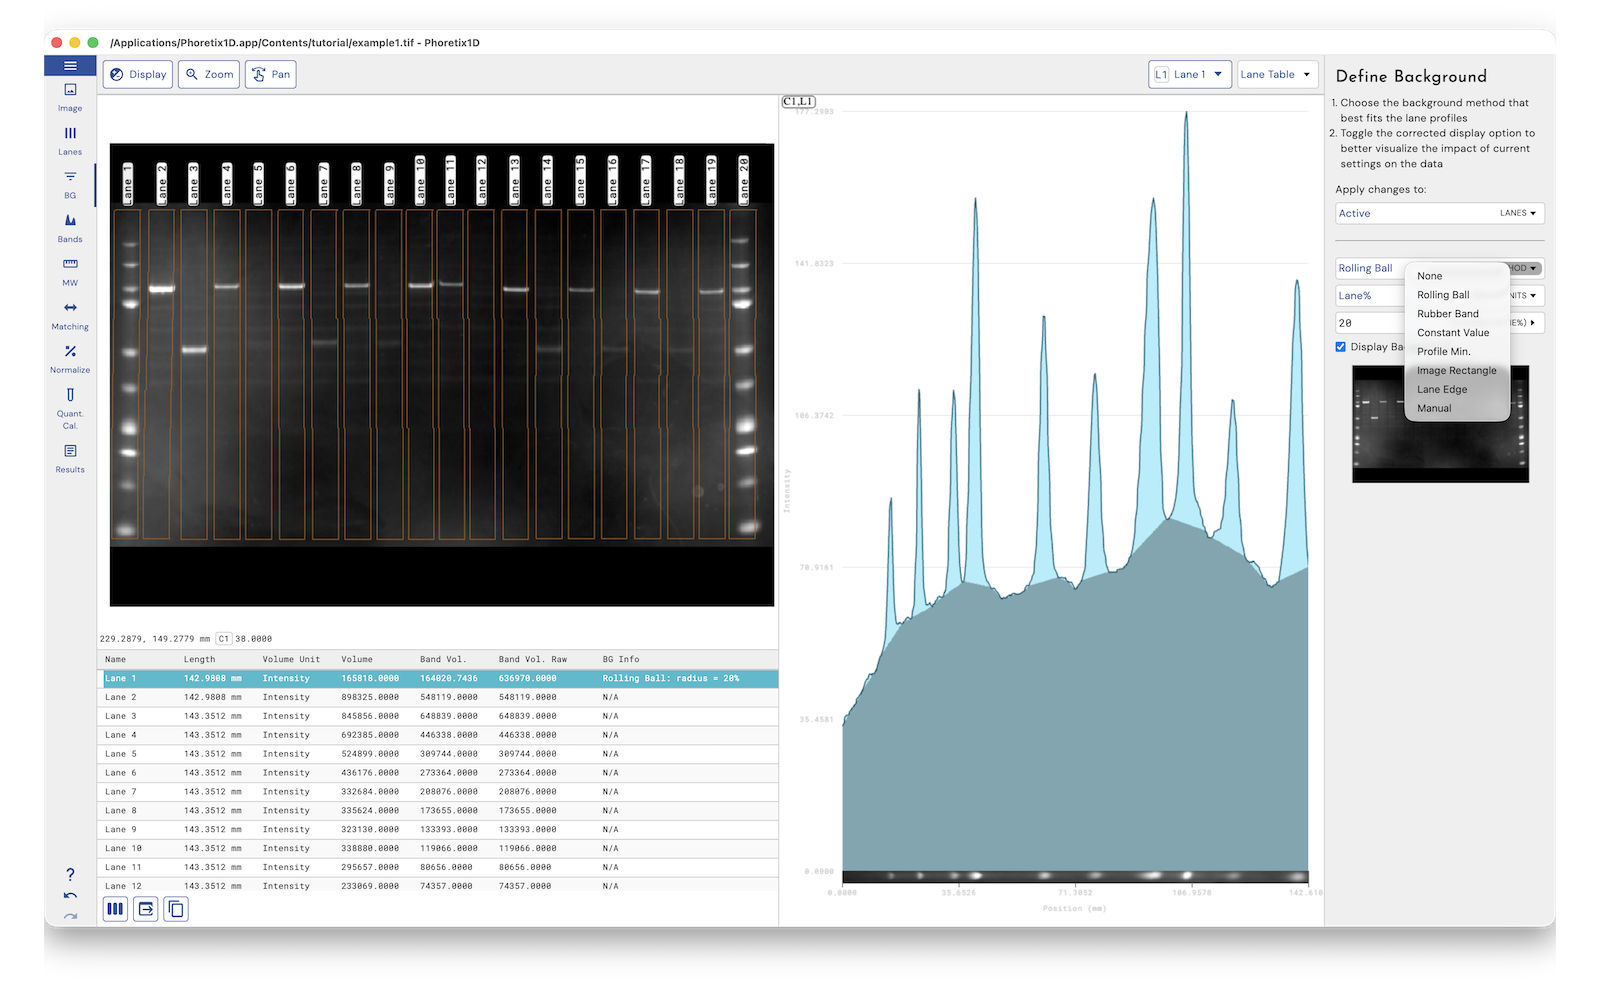
| Background subtraction | Eight methods: none; rolling ball; rubber band; constant value; profile minimum; image rectangle; lane edge; manual; set per lane and per channel | Manual baseline or rolling-ball filter | Yes | Yes | Yes | Yes | Yes (rolling ball, morphological, valley to valley, manual) |
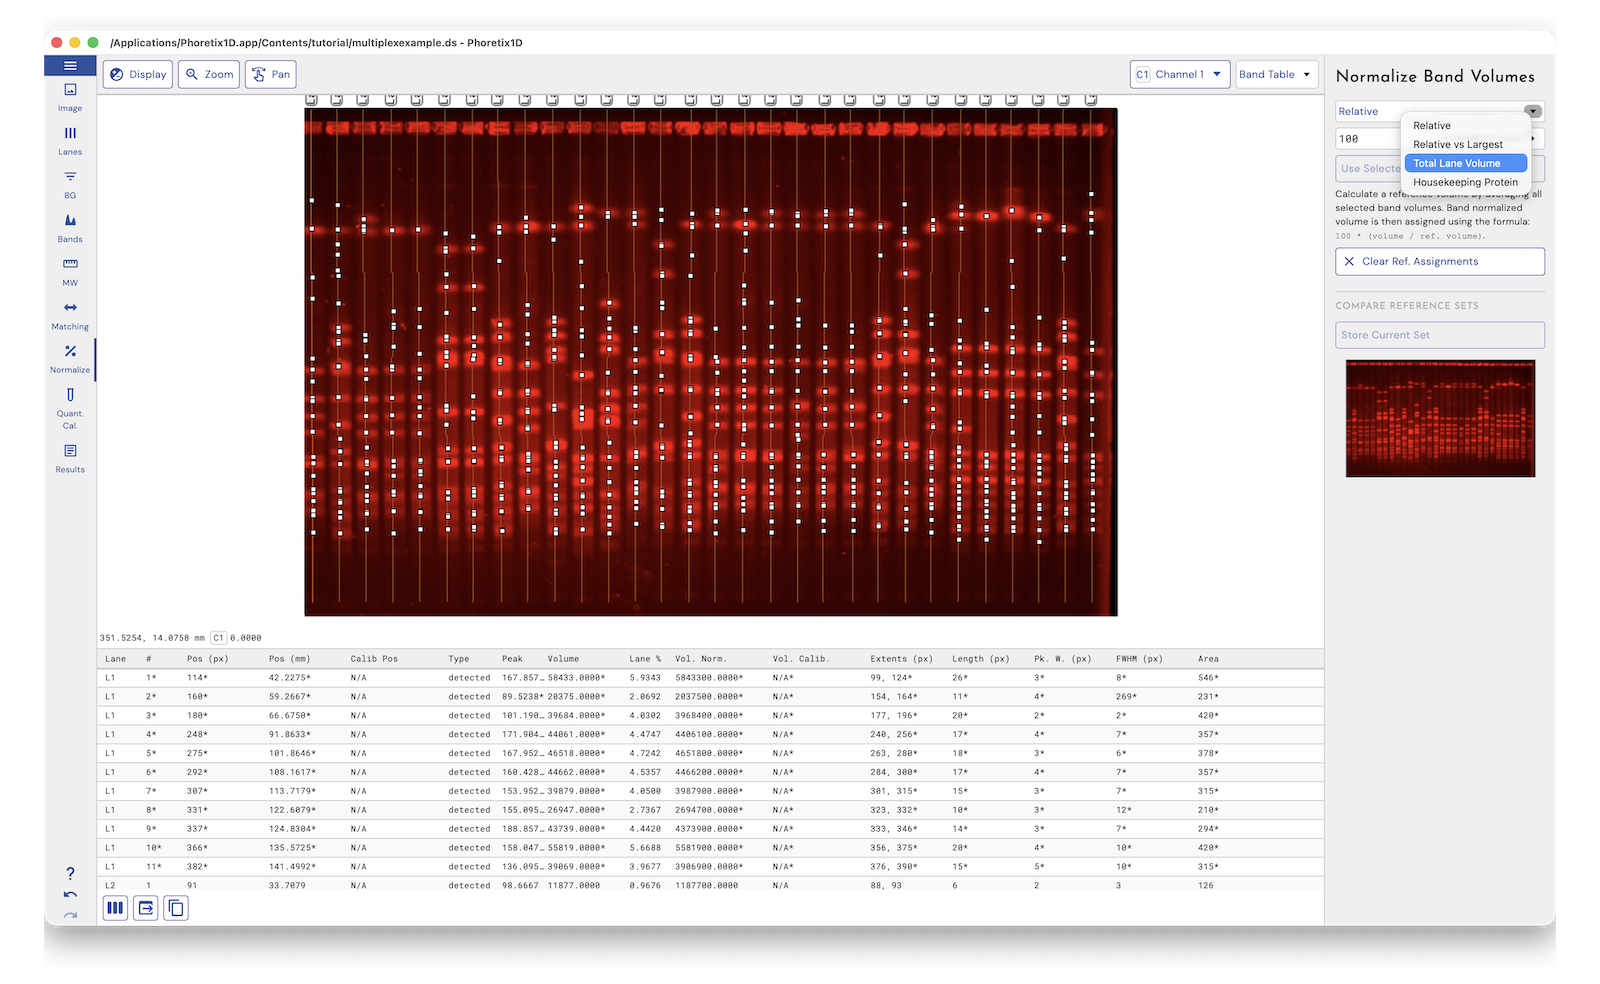
| Normalization | Reference band; most intense band; total lane volume; housekeeping channel | User formula in a spreadsheet | Total protein and housekeeping | Total protein and housekeeping (see LI-COR documentation) | Total protein normalization | Total protein and housekeeping | Volume ratio within a lane only; no normalization to a loading control |
| Molecular weight calibration | Ladder library plus custom ladders; joins multiple ladder lanes; several curve fits | Manual | Yes | Yes | Yes | Yes | Yes with Rf calibration |
| Dendrograms and band matching | Neighbor-joining and UPGMA with Dice similarity built in | No | Not listed on product page | Not listed on product page | Lane comparison with dendrograms | Not listed on product page | Not listed on product page |
| Report export | One-click PDF; CSV; clipboard | Manual (copy to spreadsheet) | PDF report | Yes | Yes | Yes | Copy tables to clipboard; text export in Plus tier; no report |
| Operating systems | Windows 11; macOS (Intel and Apple silicon); Linux; ARM | Windows; macOS; Linux | Standard: Windows and Mac; Security Edition: Windows only | macOS and Windows | Windows and macOS (see Cytiva documentation for editions) | Desktop: PC and Mac; cloud via browser | Windows; macOS (Apple silicon); Linux (.deb); Java (JDK 26+) |
| 21 CFR Part 11 | With AuditSafe: audit trail; electronic signatures; permissions; image authenticity; IQ/OQ available | No | Security Edition (Windows only) | See LI-COR documentation | GxP edition available | Secure edition | No |
| Offline or air-gapped licensing | Yes; online or offline activation | Not applicable (free) | See Bio-Rad documentation | See LI-COR documentation | See Cytiva documentation | Desktop edition yes; cloud edition needs Connect | Not applicable (free) |
Competitor facts checked against vendor documentation on 20 September 2026. Phoretix 1D facts from totallab.com. Vendor features change; confirm current specifications with each supplier.

Free tools: what you pay for with your time
ImageJ is named as the analysis tool in about one western blot paper in five, and nobody should be embarrassed to use it. The cost is not money. The ImageJ gel workflow asks the user to draw a rectangle for every lane, plot the profile, draw a baseline under each peak with the line tool, click each peak with the wand, and then carry the areas into Excel for background correction and normalization. Each of those is a judgment. Two people analyzing the same blot get two answers, and the same person on two days often does too, which is why methods sections that say “quantified in ImageJ” rarely say how.
GelAnalyzer automates lane and band detection and MW estimation, which removes a good share of the manual steps, but reporting, normalization workflow and compliance are where a free tool stops. Our detailed comparison is at Phoretix 1D vs GelAnalyzer.
The free editions of Image Lab, Image Studio and iBright Analysis Software are a different case. They are full-featured, but they are written for their own imager’s files and workflow. If every image in your lab comes from one vendor, they are hard to argue with. If it does not, read on.
Imager-bundled tools: what you give up in flexibility
The pattern across the imager vendors is consistent. The standard analysis software is free or included with the instrument, and the regulated edition is a separate license that may not run everywhere the standard one does: Bio-Rad states that Image Lab Security Edition is available for Windows computers only. Thermo describes iBright Analysis Software as software for images captured on iBright systems and stores images natively in its own G2i format alongside TIFF.
Three situations break the bundled model. The first is the mixed lab: a ChemiDoc in one room, an Odyssey in another, an older Typhoon in the core facility, and three analysis packages with three sets of settings. The second is tech transfer between sites that bought different imagers, where a validated method has to produce the same number in both places. The third is the Mac-based lab that needs Part 11.
Our per-vendor comparisons cover the specifics:
Phoretix 1D vs Bio-Rad Image Lab
Image Studio Lite replacement: Phoretix 1D vs Empiria Studio
Phoretix 1D for ImageQuant TL users
Phoretix 1D for Azure imager owners
Independent software: what Phoretix 1D does differently
Phoretix 1D is built for the modern, mixed lab. It reads 8-bit, 16-bit and higher uncompressed TIFF, multi-page and multiplex TIFF, plus IMG, JPEG, PNG and BMP, from imagers made by Bio-Rad, Cytiva, Azure Biosystems, Thermo Fisher Scientific, Syngene, Vilber and Pop-Bio among others. It runs on Windows 11, macOS through Tahoe on Intel and Apple silicon, Linux and ARM-based PCs, and one license covers a computer with no limit on the number of users.
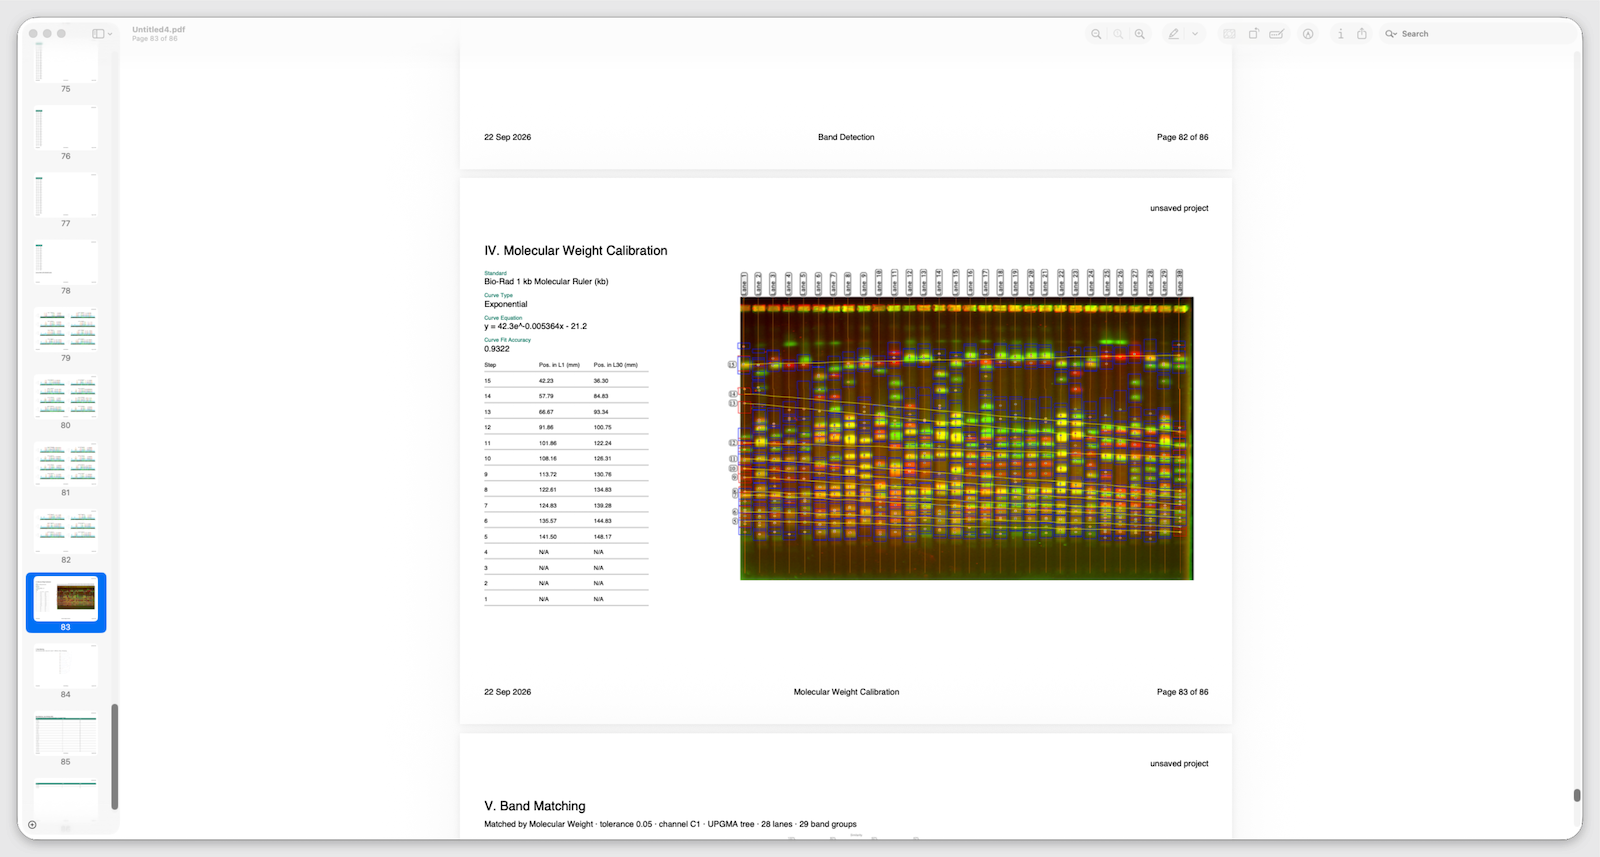
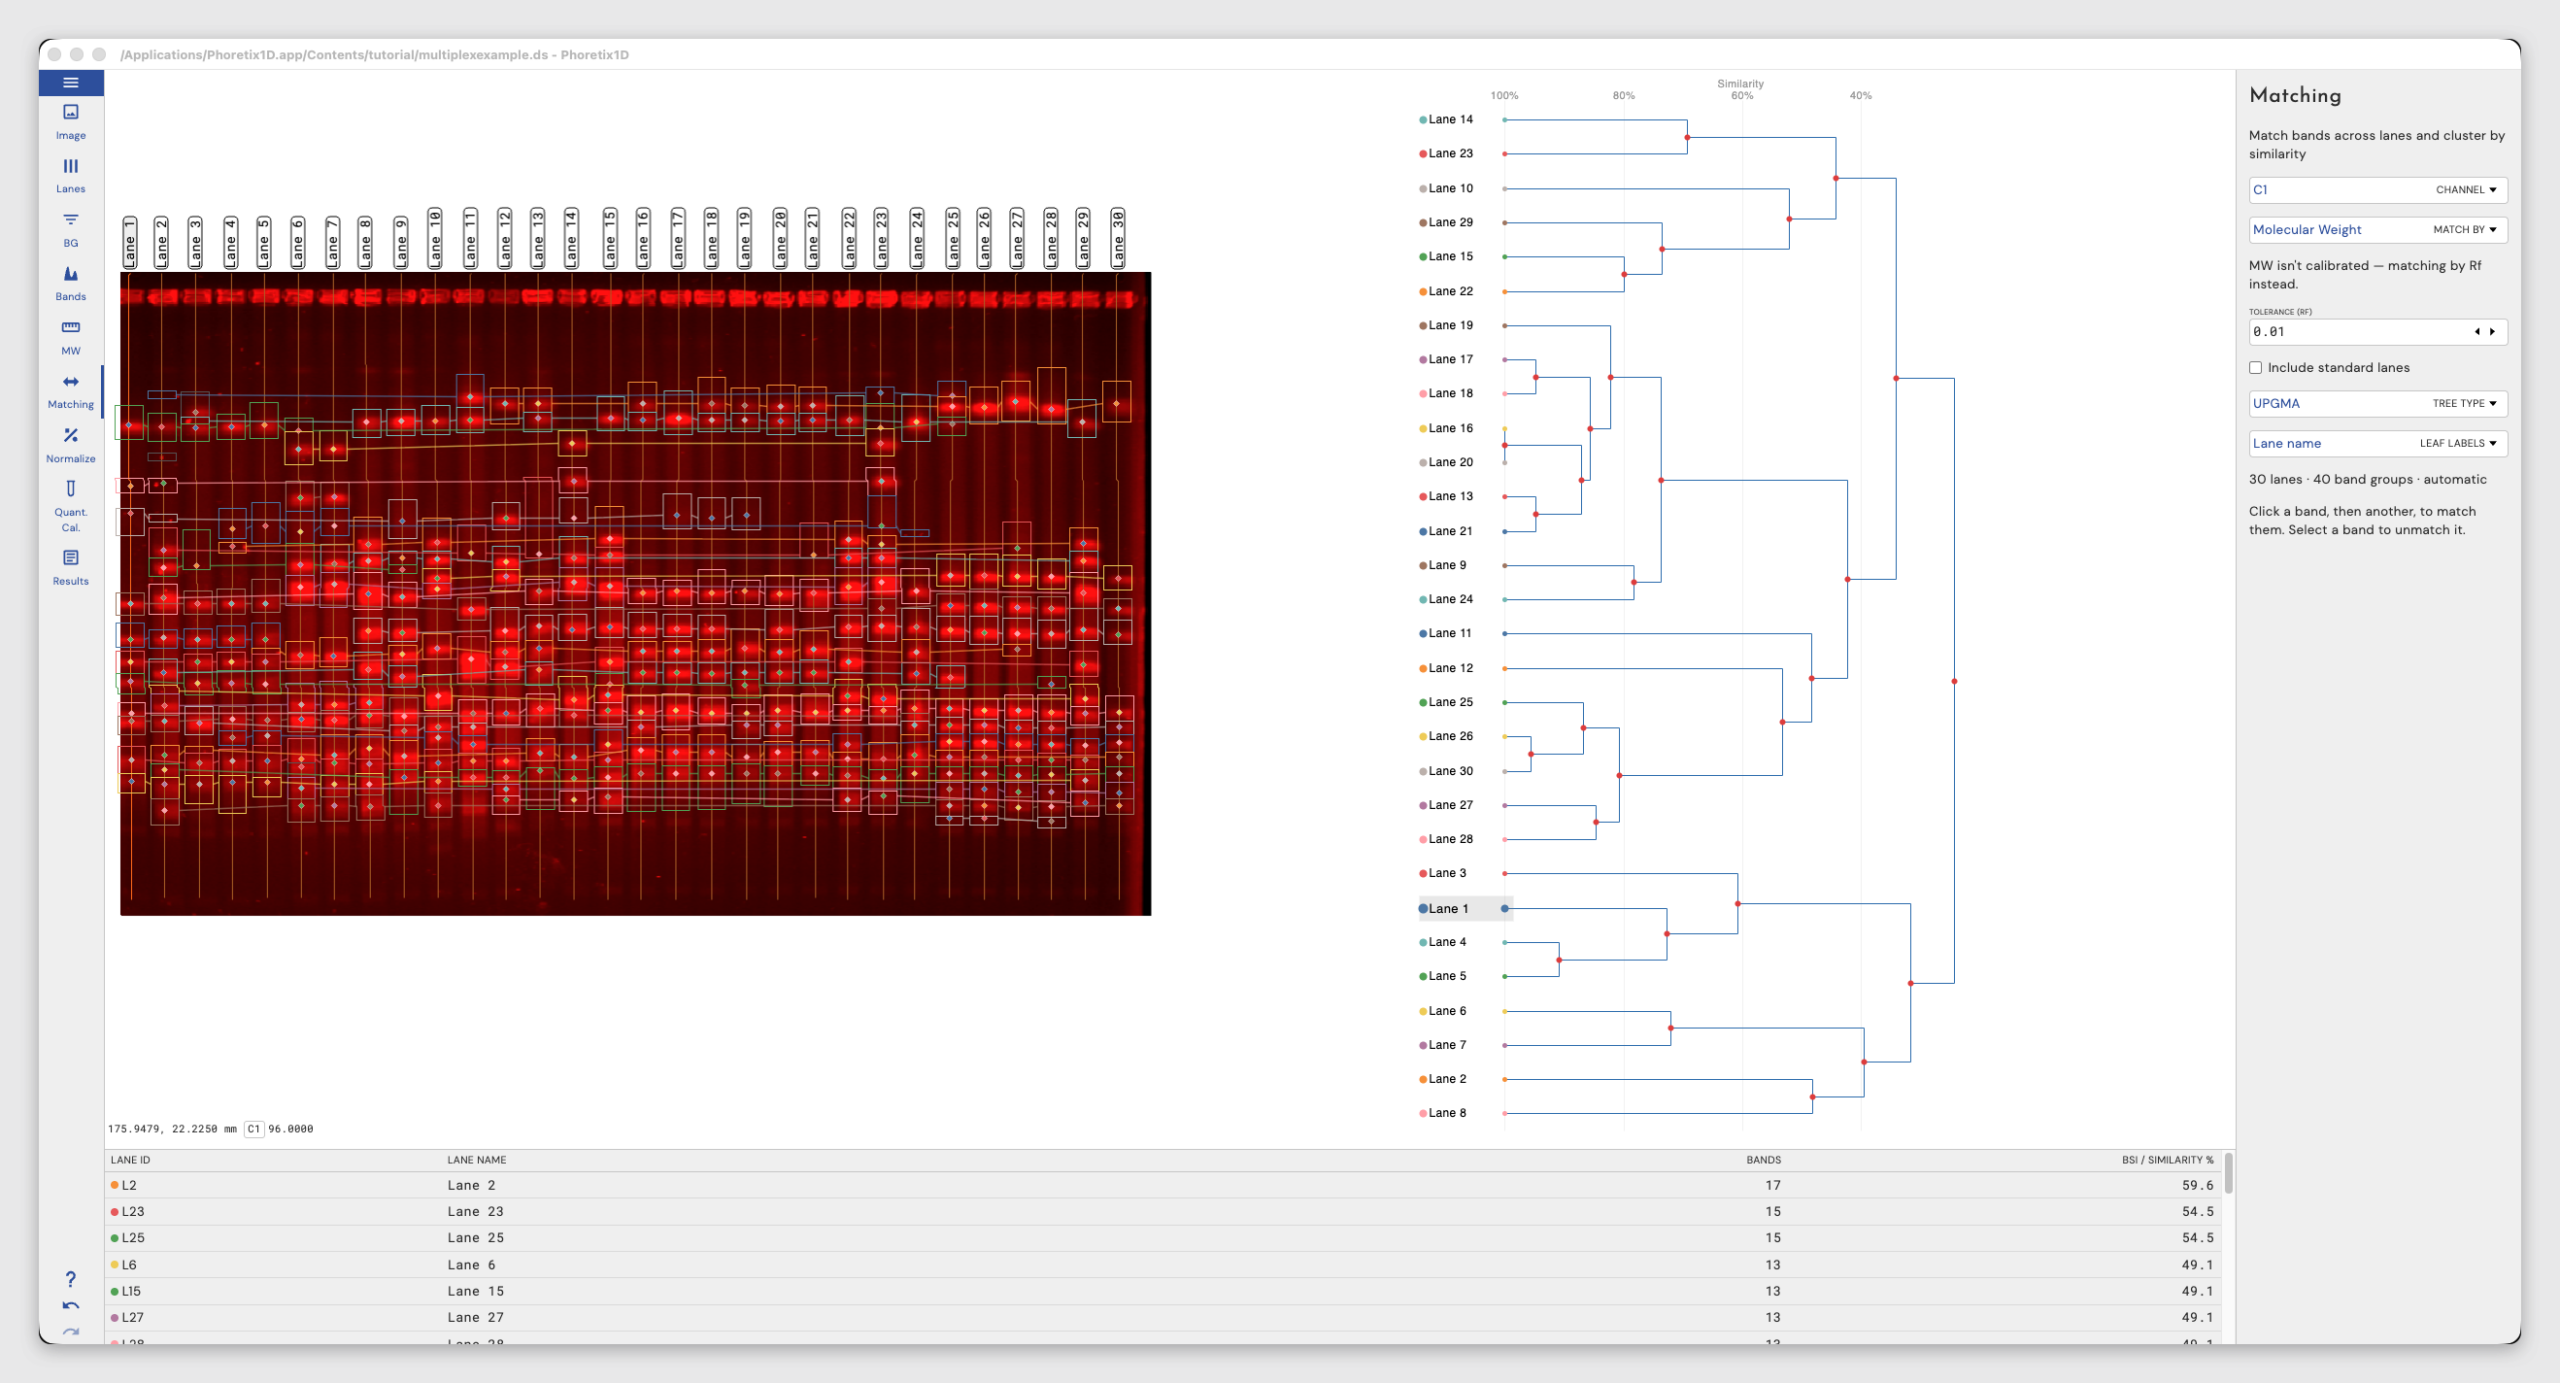
The analysis is automated end to end: lane detection that copes with distorted and empty lanes, multiple lane boxes for multi-tier gels or several blots in one image, automatic band detection with per-lane and per-channel parameters, eight background methods (none, rolling ball, rubber band, constant value, profile minimum, image rectangle, lane edge and manual) set per lane and per channel, an editable library of commercial MW ladders with the ability to join several ladder lanes across a distorted gel and nine curve types with the fit accuracy printed in the report, normalization to a reference band, the most intense band, total lane volume or a housekeeping channel, quantity calibration from three or more standards, and a one-click PDF report with CSV export. Analysis takes under a minute per image once a protocol is set. A Compare mode aligns lanes to a reference with automatic Rf correction and produces a similarity matrix, similarity scatter plot and neighbor-joining or UPGMA dendrogram on Dice similarity, for fingerprinting and strain typing.
For regulated labs, Phoretix 1D combined with AuditSafe provides audit trails, electronic signatures, granular user permissions and image authenticity verification for FDA 21 CFR Part 11 and EU Annex 11, with in-person IQ/OQ packages available. Because AuditSafe is TotalLab software rather than a vendor add-on, the compliant edition runs wherever Phoretix 1D runs.
“After having used many other software for gel image analysis, including Bio-Rad’s Image Lab and ImageJ, I started using Phoretix 1D out of necessity in a new role. I found it to be much more intuitive and streamlined than what I’ve used in the past. Background subtraction, band picking, and band analysis are all automated with optional manual adjustment if desired.”
Garry Smith, Proliant Health and Biologicals”

How to choose gel analysis software
Ask six questions before you commit to anything, free or paid.
Does it open every image format your lab produces, at full bit depth, without conversion? Does it detect lanes and bands automatically, and can you save those settings so the next user gets the same result? Can it subtract background per lane and per channel? Does it normalize to total protein as well as a housekeeping band, and does it show you the linear range so you can tell when a band is saturated? Does it produce a report someone else can audit? And if you need 21 CFR Part 11, does the compliant edition run on the computers you actually own?
We have turned those questions into a twelve-criterion scorecard you can print and take into a demo of any package, ours included
Frequently Asked Questions
What is the best software for western blot analysis?
It depends on how many imagers you own and whether you need Part 11. For a single-vendor lab, the bundled package (Image Lab, Empiria Studio, ImageQuant TL, iBright) is the path of least resistance. For a lab with mixed imagers, Mac users, Linux, or a validation requirement, independent software such as Phoretix 1D by TotalLab reads every vendor’s images and applies one automated method to all of them. ImageJ remains the free choice for occasional, non-regulated use.
Is ImageJ good enough for western blot quantification?
For occasional relative comparisons, yes, provided you report the background and normalization method. Its weakness is reproducibility: lane rectangles, baselines and peak boundaries are drawn by hand, so results vary between users. Dedicated software automates those steps and records the settings.
Is Bio-Rad Image Lab free?
The standard edition of Image Lab is a free download for Windows and Mac. The Security Edition that supports 21 CFR Part 11 is a licensed product and is available for Windows only, according to Bio-Rad’s user guide.
Can one program analyze images from different imagers?
Yes, if it reads standard TIFF at full bit depth. Phoretix 1D supports 8-bit, 16-bit and higher uncompressed TIFF plus multi-page and multiplex TIFF from any imager, alongside IMG, JPEG, PNG and BMP. Bundled packages are written around their own instrument’s files and may store images in a proprietary format first.
Which gel analysis software runs on a Mac?
Phoretix 1D runs on macOS (Intel and Apple silicon), Windows, Linux and ARM. Image Lab standard edition, ImageQuant TL 10.2, iBright Analysis Software desktop and Empiria Studio also offer Mac versions; Image Lab Security Edition is Windows only.
What does “densitometry” mean in a western blot methods section?
Densitometry is the measurement of integrated pixel intensity of a band after background subtraction, expressed relative to a loading control or total lane protein. See our guide to western blot densitometry for the full workflow.
How do I cite Phoretix 1D in a paper?
“Band intensities were quantified by densitometry using Phoretix 1D (TotalLab Ltd, Newcastle upon Tyne, UK) with rolling-ball background subtraction, and normalized to total lane protein [or: to a housekeeping band].”
Try it on your own blots
The only comparison that matters is the one on your images. Start a free Phoretix 1D trial, open a TIFF from whichever imager you own, and see whether the automated result matches what you get by hand.
References
1. Bio-Rad Laboratories. Image Lab Software product page. https://www.bio-rad.com/en-us/product/image-lab-software?ID=KRE6P5E8Z Accessed 20 Sep 2026. (Source for: standard edition free download; Security Edition licensed for Part 11.)
2. Bio-Rad Laboratories. Image Lab Software User Guide Version 6.1, document 110000076953. (Source for: Security Edition available for Windows computers only; standard edition on Windows and Mac.)
3. Cytiva. ImageQuant TL v10.2 and ImageQuant TL GxP v10.2 Release Notes, 29702850 AB. (Source for: platforms, four modules, GxP edition, total protein normalization, dendrograms, 1 GB file limit.)
4. Cytiva. ImageQuant TL 10.1 Software help, 29654108 AB. (Source for: JPG, JPEG and PNG “not recommended for quantitative analysis”.)
5. Thermo Fisher Scientific. iBright Analysis Software page. https://www.thermofisher.com/us/en/home/life-science/protein-biology/protein-assays-analysis/western-blotting/detect-proteins-western-blot/western-blot-imaging-analysis/ibright-western-blot-imaging-systems/ibright-analysis-software-connectivity.html Accessed 20 Sep 2026. (Source for: free desktop PC and Mac, cloud via Connect, Secure edition, “images captured on iBright Imaging Systems”.)
6. Thermo Fisher Scientific. iBright Imaging System Models specifications. (Source for: G2i proprietary image format alongside TIFF, JPG, PNG.)
7. LI-COR Biosciences. Image Studio Lite page, licorbio.com/image-studio-lite. Accessed 20 Sep 2026. (Source for: Image Studio Lite no longer available; Image Studio Software reinstated as a free download.)
8. SciCrunch RRID:SCR_013715, Image Studio Lite. (Source for: discontinued and replaced with Empiria Studio, documented 28 Sep 2023.)
9. LI-COR Biosciences. Best Practices for Quantitative Western Blot Data Analysis, licor.com/bio/empiria-studio/best-practices. (Source for: LI-COR images should be analyzed in Empiria Studio or Image Studio.)
10. TotalLab. Phoretix 1D product page. https://totallab.com/software/1d-gel-western-blot-analysis-software/ (Source for: all Phoretix 1D features, platforms, formats, imager compatibility, testimonial.)
11. TotalLab. The TotalLab Language Audit, 15 Sep 2026 (internal). (Source for: ImageJ named in 21 percent of 66 western blot papers; “densitometry” in 25 of 66.)