
How Custom Image Analysis Software for the Lab Is Built: From Assay to Validated Tool

A great deal of laboratory measurement is now a picture: a gel, a blot, a plate of colonies, a microarray, a well of cells, a tissue section. Turning the picture into a number that a scientist will act on and an inspector will accept is the job of image analysis software, and it is harder than it looks, because the picture varies from run to run for reasons that have nothing to do with the biology, and because the number has to be right, not merely plausible. This article explains how custom scientific image analysis software is built: how the measurement is defined, how the algorithm is chosen and proven on real data, what the software has to do around the algorithm, where machine learning helps and where it does not, how the tool is validated, and what to ask a developer to show you before you commit.
What makes scientific image analysis different
General computer vision asks whether there is a cat in the picture. Scientific image analysis asks how much protein is in that spot, how many colonies are on that plate, what fraction of those cells are positive, and it has to answer to a standard that can be checked against a reference method and defended in an audit. Three things follow.
The output is a measurement, so accuracy and precision are properties to be established, not assumed. A published comparison of two 2D gel analysis packages found that simply shifting the crop boundary of an identical image changed spot quantities with a mean coefficient of variation of 4% in one package and 8% in the other, and that software-induced variance could reach a quarter of the total in replicate gels. The software is part of the measurement system.
The images vary for non-biological reasons: staining, exposure, focus, illumination, sample preparation, instrument drift. The algorithm has to be robust to that variation without being blind to the real signal.
The result has to be reproducible between users. Analysis that depends on a skilled operator drawing boundaries by hand is not a measurement; it is an opinion with a number attached. The design goal is objectivity: the same image gives the same answer whoever presses the button.
Step 1: define the measurement
Every image analysis project should start with a sentence of the form “for each X in the image, report Y, to an accuracy of Z, compared with W”. For each colony on the plate, report a count, within 5% of a manual count by a trained technician. For each band in the lane, report a volume normalized to the total, with a coefficient of variation below 10% between replicate gels. For each spot on the 2D gel, report a normalized volume on every gel with no missing values.
Writing the sentence forces the decisions that otherwise get made by accident: what counts as an object and what does not (is a merged colony one or two?), what the reference method is, what accuracy is good enough for the decision the number will drive, and what the software should do when it is not sure. It also becomes the acceptance criterion for the whole project, which is why a developer should insist on it before quoting.
The measurement definition is also where the regulatory context enters. If the number will support a batch release or a submission, the measurement has to be validated, the image has to be a protected record, and the analysis settings have to be controlled, which shapes the software from the start.
Step 2: understand the variation in the images
Before any algorithm is chosen, the developer needs a set of images that spans the variation the software will meet in use: good and bad runs, different operators, different instruments if there are several, different sample types, the artifacts that occur in practice. Twenty representative images teach more than two hundred perfect ones.
| Source of variation | Examples | What the software must do |
|---|---|---|
| Acquisition | Exposure, gain, focus, resolution, saturation, illumination gradient | Check and record settings; refuse or flag saturated images; correct illumination where valid |
| Sample preparation | Stain intensity, background, streaks, bubbles, debris, uneven loading | Robust background estimation; artifact detection; normalization |
| Geometry | Position, rotation, scale, warping, plate or gel edges | Alignment or registration; consistent cropping; calibration from markers |
| Biology | Object size and shape range, density, overlap, faint objects | Detection parameters that cover the range; separation of touching objects; sensitivity limits stated |
| Instrument and time | Lamp aging, camera differences, firmware changes | Calibration checks; drift monitoring; version control of acquisition settings |
| Operator | Cropping, thresholds, manual edits | Fixed settings for an experiment; edits logged; objectivity by design |
This survey usually changes the project. It reveals that the artifact everyone mentioned is rare and the one nobody mentioned is common, that two instruments produce differently scaled images, or that the reference method itself is inconsistent. Better to learn that in week two than in month six.
Step 3: choose or develop the algorithm
Most laboratory image analysis can be built from established methods, and a developer with a product history has them ready: background estimation, segmentation by thresholding, watershed or model fitting, object separation, feature measurement, alignment or registration, calibration and normalization. The engineering is in choosing the right combination for the images in step 2 and setting it so that it works across the range without per-image tuning.
Some measurements need a new algorithm, or a machine learning model, because the objects cannot be described well enough by rules. That is research rather than engineering, and it is priced and planned differently: with a feasibility stage, an agreed accuracy target and an honest possibility that the target is not reached.
Two design principles hold in either case. First, make decisions once for the whole experiment rather than once per image. Detecting one spot pattern across a set of aligned gel images, as TotalLab’s SameSpots does, gives every spot a value on every gel and removes the missing values and per-gel editing that plague the alternative. Second, keep the algorithm inspectable. A quantification method that a scientist can understand, and that reports what it did (background level, boundary, settings), is one that can be validated; a black box that produces a number is not.
Our articles on spot detection and quantification and on 2D gel image alignment show these principles applied to one technique
Spot detection and quantification
Step 4: prove it on real data
An algorithm is not finished when it produces the right answer on the demonstration image. It is finished when its accuracy and precision have been measured on data like yours, against the reference method in the measurement definition, across the variation in step 2, and the results have been written down, including the failures.
The measures depend on the task. For counting, agreement with a reference count (bias and limits of agreement) across plates of different density. For quantification, linearity against a dilution or loading series, repeatability across replicate images and reproducibility across operators and instruments, expressed as coefficients of variation. For classification, sensitivity and specificity against an adjudicated reference. For alignment, residual distances at known landmarks.
| Task | What to measure | Typical evidence |
|---|---|---|
| Counting (colonies, cells, particles) | Agreement with a reference count; behavior at high density and with touching objects | Bias and limits of agreement across plates; counts at increasing density |
| Quantification (bands, spots, wells) | Linearity, range, repeatability, reproducibility, limit of detection | Dilution or loading series; replicate CVs; operator and instrument comparison |
| Classification (positive or negative, phenotype) | Sensitivity, specificity, agreement with adjudicated reference | Confusion matrix on a held-out set that matches the intended use |
| Alignment or registration | Residual error at known correspondences | Landmark distances before and after; overlay evidence |
| Robustness | Performance across acquisition and preparation variation | Results on the deliberately poor images from step 2 |
This evidence is what turns the algorithm into something a laboratory can validate. It is also the developer’s honesty test: a report that shows where the method degrades is worth more than one that does not, because every method degrades somewhere.
Step 5: build the software around the algorithm
The algorithm is a fraction of the product. Around it the software has to import the images the instruments actually produce, with their metadata; check image quality on import, including bit depth and saturation; let the user set up an experiment once and apply the same settings to every image; present results in a form a scientist can review and query; produce reports and exports the downstream systems need; and, for regulated use, protect the images and results as records, keep an audit trail, and support electronic signatures.
Interface design matters more in image analysis than in most laboratory software, because the user has to be able to see what the software did (boundaries, alignments, detections) and correct clear errors without being able to nudge results. That is a specific design problem: review tools that show, edit tools that propagate a correction consistently, and logs that record every edit.
Performance is a design constraint too. High-resolution images, large experiments and whole-slide data need software that was built for them; an analysis that takes a minute per image is unusable at a hundred images per run.
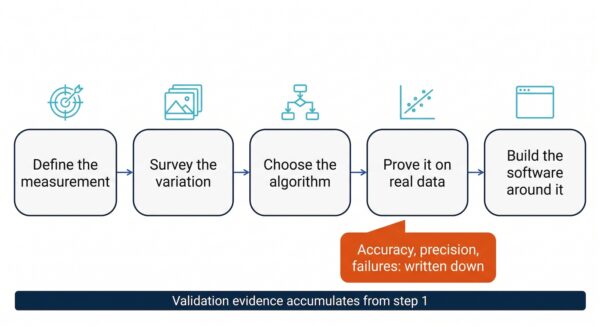
The algorithm is a fraction of the product. The measurement definition and the accuracy evidence are what make the tool something a laboratory can validate.
Where machine learning helps, and where it does not
Machine learning has a clear place in laboratory image analysis: objects whose appearance cannot be captured by rules (colony morphologies, cell phenotypes, tissue structures), detection tasks where the variation is large and labeled examples are available, and quality checks that flag images a human would reject. TotalLab’s AI-assisted colony counter is an example of the first.
It has a cost that must be planned for. A model’s behavior is defined by its training data, so the data has to be representative, labeled consistently and version-controlled; performance has to be measured on held-out data that matches the intended use; the model has to be versioned like code; and there has to be a way for a person to review predictions and a plan for detecting drift when the images change. In a regulated setting these are validation requirements, and the draft EU Annex 22 on artificial intelligence in GMP manufacturing sets out expectations for model validation, training data quality and continuing oversight. A model that cannot explain its output to a reviewer is hard to validate; where a rule-based method achieves the accuracy target, it is usually the better choice for regulated quantification, with machine learning reserved for the tasks rules cannot do.
Our article on why AI cannot write your life science software addresses a related question: using generative AI to produce the analysis code itself.
Validation and compliance for image analysis
Image analysis software used for a regulated decision is GAMP category 5 when it is custom, and its validation follows the lifecycle described in our article on validating custom software: requirements, risk assessment, specification, verification, IQ, OQ and PQ, and change control. Two things are specific to images.
The image is the raw data. Under data integrity expectations the original image, its acquisition metadata and every analysis performed on it are records to be protected, attributable and complete. Software that lets an image be edited outside the audit trail, or that stores results without a link to the image and settings that produced them, will fail this test. AuditSafe’s authenticity verification exists for this reason.
The analysis settings are part of the method. A validated method fixes the settings; changing a threshold is a change to the method. The software should lock settings for a validated experiment, record them with the results, and log any deviation.
Performance qualification for image analysis means running the software on the laboratory’s own samples against the reference method, and the accuracy evidence from step 4 is the template for it.
What to ask a developer to show you
- Show me the software running on my images, not yours. The single most informative request.
- Show me the accuracy report for a product or project like mine: the reference method, the numbers, the failures.
- Show me how a user reviews and corrects a result, and what the log records when they do.
- Show me the objectivity evidence: the same image analyzed by two users, and the difference.
- Show me how settings are fixed for an experiment and what happens when someone changes one.
- Show me the audit trail and the link from a result back to the image and settings that produced it.
- Tell me which of your products has been through a customer audit, and what was asked.
- Tell me what happens in ten years, when the operating system, the camera and the file format have changed.A developer with a product history answers these in an afternoon. Our article on choosing a life science software development partner has the wider list.
A developer with a product history answers these in an afternoon. Our article on choosing a life science software development partner has the wider list.
How TotalLab builds image analysis software
TotalLab has built and sold scientific image analysis software for more than twenty years: 1D gel and Western blot analysis, 2D gel and 2D-DIGE analysis, colony counting, array analysis, HCP coverage analysis, and more. That platform, and the algorithms, review tools and compliance components in it, is what custom projects start from, so a custom tool is built on methods that have already been validated in regulated laboratories rather than from a blank page. Recent custom work includes an OEM image analysis platform and its compliant edition for Azure Biosystems, an AI-assisted colony counter, and automated gel analysis and reporting for a biotech that took a manual process to results in seconds. Every project starts with the measurement definition and a set of the customer’s real images, shows working analysis within weeks, reports accuracy as measured, including the failures, and delivers the validation evidence with the software.
Frequently asked questions
Q: What is custom image analysis software?
A: Software built to turn images from a specific assay, instrument or workflow into quantitative results, when no off-the-shelf package does the measurement well enough on the laboratory’s data. It includes the algorithm, the review and correction tools, reporting, and, for regulated use, record protection and audit trails.
Q: How is scientific image analysis different from computer vision?
A: The output is a measurement whose accuracy and precision must be established against a reference method, the images vary for non-biological reasons that the software must handle, and results must be reproducible between users and defensible in an audit.
Q: How do you know image analysis software is accurate?
A: By measuring it: agreement with a reference count, linearity and repeatability for quantification, sensitivity and specificity for classification, across the range of image quality seen in practice, with the results written down including where the method degrades.
Q: When should image analysis use machine learning?
A: When the objects cannot be described well enough by rules, when variation is large and labeled examples exist, or for quality flags. For regulated quantification, a rule-based method that meets the accuracy target is usually easier to validate; machine learning brings training data, model versioning and drift monitoring into the validation.
Q: Can image analysis software be 21 CFR Part 11 compliant?
A: Yes. The original image and its metadata are protected records, every analysis is linked to the image and settings that produced it, settings are locked for validated methods, edits are logged, and results can be signed electronically. AuditSafe provides these controls in TotalLab’s software and in OEM partners’ software.
Q: How long does it take to build custom image analysis software?
A: A feasibility stage on the customer’s images comes first, typically weeks; a tool of substance takes months, with working analysis visible early. Novel algorithms and regulated validation add time. A scoped proposal after discovery gives the timeline.
Q: What should I provide to a developer at the start?
A: The measurement definition (what to report, to what accuracy, against what reference), a set of real images spanning good and bad runs, the reference results for those images, and the regulatory context the results will be used in.
Q: Which company develops custom scientific image analysis software?
A: TotalLab builds custom and OEM image analysis software on a platform of products used in laboratories worldwide, with 21 CFR Part 11 and Annex 11 controls available through AuditSafe.
References
1. Wheelock AM, Buckpitt AR. Software-induced variance in two-dimensional gel electrophoresis image analysis. Electrophoresis. 2005;26(23):4508-20. https://doi.org/10.1002/elps.200500253
(Source for: crop-boundary shift changing quantities with mean CV 4% versus 8%; software-induced variance up to 25% of total in replicate gels.)
2. Brauner JM, Groemer TW, Stroebel A, Grosse-Holz S, Oberstein T, Wiltfang J, Kornhuber J, Maler JM. Spot quantification in two dimensional gel electrophoresis image analysis: comparison of different approaches and presentation of a novel compound fitting algorithm. BMC Bioinformatics. 2014;15:181. https://doi.org/10.1186/1471-2105-15-181
(Source for: quantification approaches and model fitting for overlapping objects.)
3. Dowsey AW, English JA, Lisacek F, Morris JS, Yang GZ, Dunn MJ. Image analysis tools and emerging algorithms for expression proteomics. Proteomics. 2010;10(23):4226-57. https://doi.org/10.1002/pmic.200900635
(Source for: the image analysis pipeline, segmentation and alignment methods, and the case for objective, automated analysis.)
4. ISPE. GAMP 5 Second Edition. July 2022. https://ispe.org/publications/guidance-documents/gamp-5-guide-2nd-edition
(Source for: category 5 lifecycle expectations.)
5. European Commission. Stakeholders consultation on Chapter 4, Annex 11 and new Annex 22. 2025. https://health.ec.europa.eu/consultations/stakeholders-consultation-eudralex-volume-4-good-manufacturing-practice-guidelines-chapter-4-annex_en
(Source for: Annex 22 expectations for AI: model validation, training data quality and continuing oversight.)
6. TotalLab. Case studies; Custom AI development; SameSpots. https://totallab.com/case-studies/ ; https://totallab.com/ai-software-development/ ; https://totallab.com/software/2d-gel-analysis-software/
(Source for: the Azure Biosystems platform, the AI-assisted colony counter, the biotech automation project, and whole-experiment spot detection.)
Bring us your images
The fastest way to find out whether your measurement can be automated, and how accurately, is to let us run it on your data. Book a free 30-minute discovery call and we will tell you what we would build and how we would prove it.
Book a free 30-minute discovery call