
DIA vs DDA for Host Cell Protein Analysis: Why Acquisition Strategy Decides Your Reproducibility

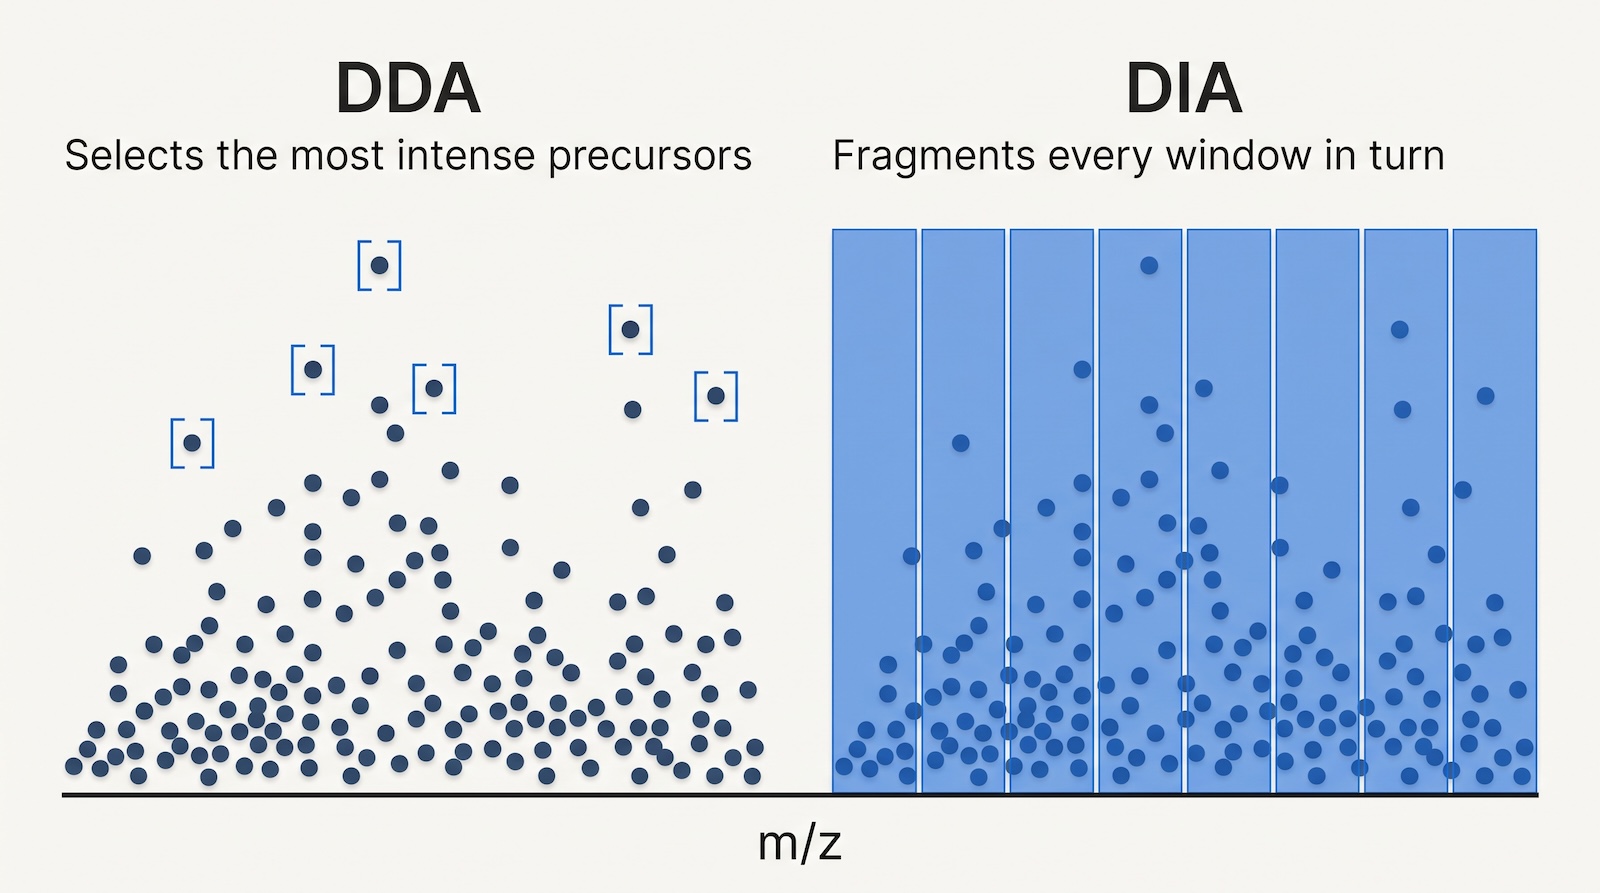
For residual host cell protein (HCP) work, data-independent acquisition (DIA) is the more reproducible choice and data-dependent acquisition (DDA) is not. DDA decides what to fragment while the sample is running, and in an HCP sample that decision is made in the worst conditions possible: a survey scan dominated by product peptides, with the analytes of interest four to six orders of magnitude below them. DIA removes the decision, fragmenting every precursor in a defined m/z window, every cycle, in every injection. That is what makes batch trending, comparability and method qualification possible.
Key facts
- DDA selects precursors for fragmentation by intensity in a survey scan. DIA fragments all precursors in sequential m/z windows regardless of intensity.
- SWATH-MS is SCIEX’s implementation of DIA, introduced by Gillet et al. in Molecular & Cellular Proteomics in 2012 using 32 consecutive 25 m/z windows.
- Residual HCPs are controlled at roughly 1 to 100 ng per mg of product, and HCP abundance spans more than six orders of magnitude across process pools.
- USP General Chapter <1132.1> frames the gap in the vendors’ own terms: the highest dynamic ranges reported by mass spectrometry vendors are around ten to the fifth, while the goal of most HCP analyses is detection at ppm levels.
- In one monoclonal antibody drug product study, DIA identified 146 HCPs where DDA selecting the top five most intense precursors identified 8.
- Changing only the processing software on identical SWATH data raised average HCP identifications 51.3% in a 2025 adeno-associated virus (AAV) study.
- USP General Chapter <1132> puts the detection limit of “many LC-MS/MS methods” at about 10 to 100 ng of HCP per mg of product, which is at or above the levels most products are controlled to.
- In a 2020 multi-company survey of 18 biopharmaceutical companies, mass spectrometry acquisition mode split evenly at 6 DDA and 6 DIA, with around 64% using relative rather than absolute quantitation [20].
- MRM and PRM remain the most precise option for a single named HCP, and are the confirmation layer after DIA.
DDA, DIA, SWATH, PRM and MRM defined
Data-dependent acquisition (DDA) runs a full-scan MS1 survey, ranks the precursors it sees by intensity, then fragments the top N, typically 5 to 80, placing those already fragmented on a dynamic exclusion list. The selection is made in real time, from what the detector happens to see in that millisecond.
Data-independent acquisition (DIA) steps through a predefined series of isolation windows covering the full m/z range and fragments everything inside each window, without reference to intensity. The same windows run in every cycle and every injection, so the acquisition is deterministic.
SWATH-MS (sequential window acquisition of all theoretical fragment ion spectra) is a vendor implementation of DIA, developed on SCIEX quadrupole time-of-flight instruments and published by Gillet et al. (2012) using 32 consecutive, slightly overlapping 25 m/z windows and a 3.3 second cycle. All SWATH is DIA; not all DIA is SWATH.
Multiple reaction monitoring (MRM), also called selected reaction monitoring (SRM), is targeted: a triple quadrupole monitors a short, predefined list of precursor-to-fragment transitions and nothing else. Lange et al. (2008) describe the two-stage mass filtering as giving “high selectivity, as co-eluting background ions are filtered out very effectively,” with linear response across up to five orders of magnitude. Parallel reaction monitoring (PRM), from Peterson et al. (2012), isolates the same precursors but records the full fragment spectrum at high resolution, so it is more specific per peptide. Neither is an alternative to DIA for survey work: they measure only what you told them to measure.

Why acquisition strategy matters more for HCP than for discovery proteomics
Acquisition choice matters more in HCP testing because the dynamic range is extreme and the measurement is repeated on many batches over years. In a cell lysate most proteins sit within three or four orders of magnitude of each other and DDA samples them reasonably. In a purified drug substance, one protein is the entire background. Manufacturers typically control total HCP below 100 ppm, and individual high-risk host cell proteins far below that. As Guo et al. (2023) put it in mAbs, “a regular one-dimensional LC-MS/MS method reaches its limits when attempting to resolve sample components … across abundance differences of >5 orders of magnitude.” Put DDA into that sample and the survey scan is almost entirely product peptides, so the top N list fills with them. An HCP peptide at 1 ppm has to be the Nth most intense ion at the exact moment its peak elutes, against a co-eluting product peptide six orders of magnitude more abundant.
It helps to anchor that against the pharmacopeia rather than against a vendor benchmark sheet, and USP General Chapter <1132.1> does exactly that arithmetic in its section on mass spectrometry analysis. It notes that the highest dynamic ranges reported by mass spectrometry vendors are around ten to the fifth, and that the goal of most HCP analyses is detection at ppm levels. Put those two statements next to each other and the problem is stated by USP rather than by anyone selling anything: the best figure the instrument makers claim is roughly the size of the gap you are trying to see across, before you lose any of it to a survey scan filled with product peptides. There is no headroom to spend on an acquisition strategy that samples the low end at random.
The older immunoassay chapter puts the same point in concentration terms. USP General Chapter <1132> states that “The detection limit for many LC-MS/MS methods is currently in the range of about 10 to 100 ng of HCP per mg of product”, and separately that “final products may have HCP levels ranging from <1 to 100 ng/mg (showing many logs of clearance)”. The detection limit it describes sits on top of, or above, the concentration range you are trying to control. The DIA figures quoted below, a lower limit of quantification near 0.6 ng/mg, sit more than an order of magnitude beneath it. Acquisition strategy is a large part of how that gap was closed.
USP is not neutral on the underlying technique, either. Writing for USP, Anthony Blaszczyk and Niomi Peckham state that “Bottom-up LC-MS/MS is the standard HCP quantitation method”. USP General Chapter <1132.1> is written around a digest-and-analyze workflow. It describes both acquisition modes in its Section 4.3 without prescribing either, which leaves the DIA versus DDA choice as the analyst’s, and as the decision that sets how reproducible the resulting numbers are.
The missing values problem, in plain terms
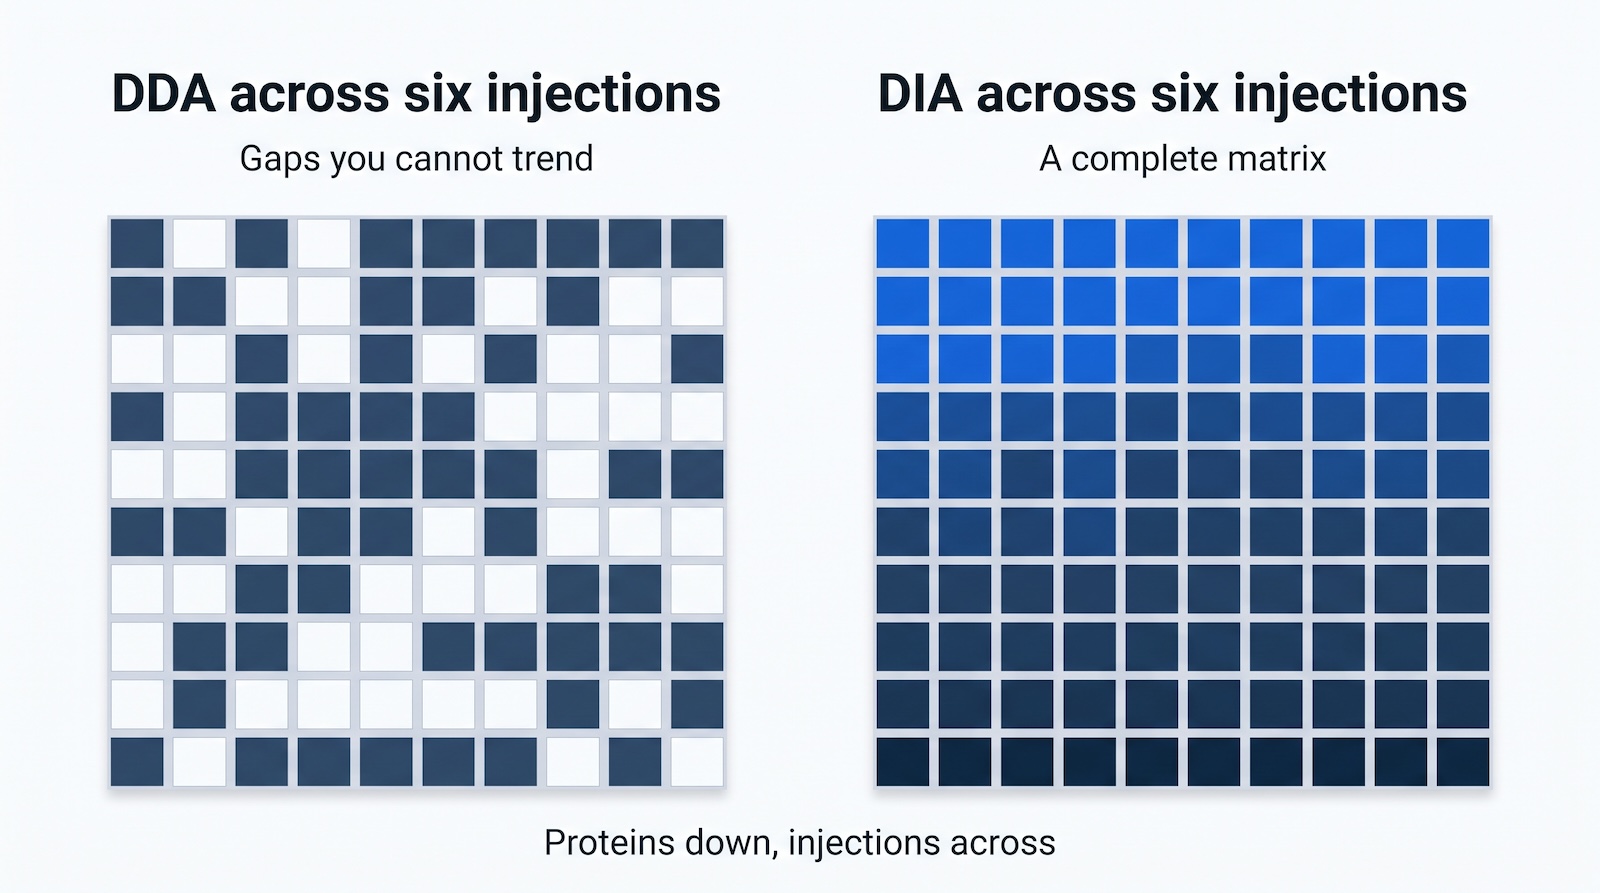
A missing value is a peptide or protein detected in one injection and not in another, when the analyte was present in both. In DDA these are not noise around a true value but absences created by the selection logic, distributed differently in every injection.
This page’s central argument is also USP’s. Section 4.3 of USP General Chapter <1132.1> describes DDA precursor selection as limited by instrument speed and by the time a peptide spends eluting, notes that low-abundance HCP peptides can be missed as a result, and says the selection process can be “stochastic and vary from one injection to the next” (USP <1132.1>, Section 4.3), so low-abundance peptides may not be detected consistently across replicate injections. That is the missing values problem, named by the pharmacopeia, in a chapter written for exactly this application.
The chapter is even handed about the alternative, and so should this page be. On the advantage of DIA it notes that MS/MS data are collected for everything all of the time, with no precursor selection criteria applied. On the disadvantage it is direct: the resulting spectra are complex, and interference from coeluting peptides can reduce confidence in the result. It adds that building a spectral ion library improves confidence, and its Terminology entry records that identification without a library is also possible. Both of those trade-offs are real, and the second half of this page is about managing the one DIA creates.
Ludwig et al. (2018), the standard DIA tutorial in Molecular Systems Biology, state that when the same sample is run on the same instrument in both modes, “the number of missing values in DDA data sets still remains higher than for data acquired in SWATH-MS mode, especially for peptides and proteins in the low concentration range.” That is the whole problem, because the low concentration range is the only one HCP testing cares about. Trending breaks, because a ppm value that drops out of one batch and returns in the next looks like a process change when it is an acquisition artifact (see how HCP ppm is calculated from LC-MS data). Comparability breaks, because comparing a clinical lot to a qualification lot requires that absence mean something.
Two HCP studies put numbers on this. Khalil and Plisnier (2025) spiked stable isotope labeled Chinese hamster ovary (CHO) HCP standards into NISTmAb across seven levels, running parallel DDA (Top80) and DIA (4 Th windows) in triplicate. DDA showed “over 50% of peptides dropping out at lower spike levels” while DIA held coverage, with a lower limit of quantification near 0.6 ppm for DIA against 1.6 ppm for DDA. Strasser et al. (2021) found DIA identified 146 HCPs in monoclonal antibody drug products where top-five DDA identified 8.
| Attribute | DDA | DIA (including SWATH) | PRM / MRM |
|---|---|---|---|
| Precursor selection | Real time, intensity-ranked top N from the MS1 survey scan | Predefined m/z windows, all precursors fragmented regardless of intensity | Predefined precursor list only, nothing else measured |
| Determinism across injections | Stochastic; selection differs run to run | Deterministic; identical window schedule every run | Deterministic; identical transition list every run |
| Missing values in low-abundance analytes | High, and unevenly distributed between injections | Low; a peptide is either extractable from the map or not | None for targets; everything else is invisible |
| Usable dynamic range in a purified product | Limited by survey scan dominance of product peptides | Wider; MS2 extraction is not gated by MS1 ranking | Widest per target; up to five orders of magnitude linear response |
| Reproducibility (replicate CV) | Degrades sharply at low abundance | Median CV below 10% reported for triplicate SWATH injections in AAV HCP work | Best in class; the reference method for precision |
| Proteome breadth per run | Moderate; drops with sample complexity | Broad; the survey layer for unknown HCPs | Narrow by design |
| Spectral library requirement | None; spectra are searched directly against a FASTA database | Optional; experimental library, predicted library, or library-free processing | Not a library, but a qualified transition or peptide list per target |
| Absolute quantification | Possible with standards, limited by missing values | Label-free relative and ppm estimation; standards for absolute | Strongest; designed for stable isotope labeled internal standards |
| Data file size and processing load | Smaller files, faster search | Larger files, heavier processing, convolved MS2 spectra | Small files, minimal processing |
| Throughput per sample | Good | Good; 30 to 60 minute gradients are workable | Very good once the assay exists, but assay development is slow |
| Best use in HCP work | Building spectral libraries; upstream and high-abundance samples; identification-only questions | Routine release, stability, batch comparison, clearance studies, process characterization | Confirming and precisely quantifying a named high-risk HCP |

Reproducibility and the regulated lab
In a regulated laboratory the argument for DIA is a precision argument, not a coverage argument. ICH Q2(R2), adopted 1 November 2023, defines precision as “the closeness of agreement (degree of scatter) between a series of measurements obtained from multiple samplings of the same homogeneous sample under the prescribed conditions,” split into repeatability and intermediate precision, the latter covering “different days, different environmental conditions, different analysts and different equipment.”
You cannot demonstrate either on an analyte present in two of six injections. An acquisition strategy that produces absences rather than measurements produces no distribution to scatter around. That is the mechanical reason DDA is hard to qualify for low-level HCP quantification. Run-to-run consistency is also what lets you say a clearance step performed the same way in campaign three as in campaign one.
USP General Chapter <1132.1>, Residual Host Cell Protein Measurement in Biopharmaceuticals by Liquid Chromatography-Mass Spectrometry, approved for publication on 1 November 2024 in USP-NF 2025 Issue 1 and official from 1 May 2025, is the first compendial chapter dedicated to LC-MS HCP measurement. It sets expectations for sample preparation, separation, quantitation and method performance, and it describes both acquisition modes and their trade-offs in Section 4.3 without mandating either. Its Section 5.3 recommends a system suitability sample consisting of an HCP spiked into the product at a known level, and makes the point that this matters most when nothing is found, because a negative result needs evidence that the measurement was working. On a DDA method whose low-abundance sampling varies between injections, that evidence is harder to produce and harder to defend. See also running USP <1132.1> Methods A, B and C and what USP <1132.1> means for your HCP software.
The analysis layer, where DIA HCP results are actually won or lost
Choosing DIA solves the sampling problem and creates an interpretation problem. Every DIA MS2 spectrum mixes fragments from every precursor in the window, and such spectra, as Guo et al. note, “have the downside of challenging computational deconvolution.” In the 2025 AAV study by Leibiger, Min and Lee in Frontiers in Bioengineering and Biotechnology, changing only the processing software on the same SWATH data raised average protein identifications 51.3%, “from 2,188 in Skyline (Skyline-IS-6600) to 3,310 in DIA-NN (DIA-NN-6600).”
Library-based DIA versus library-free DIA
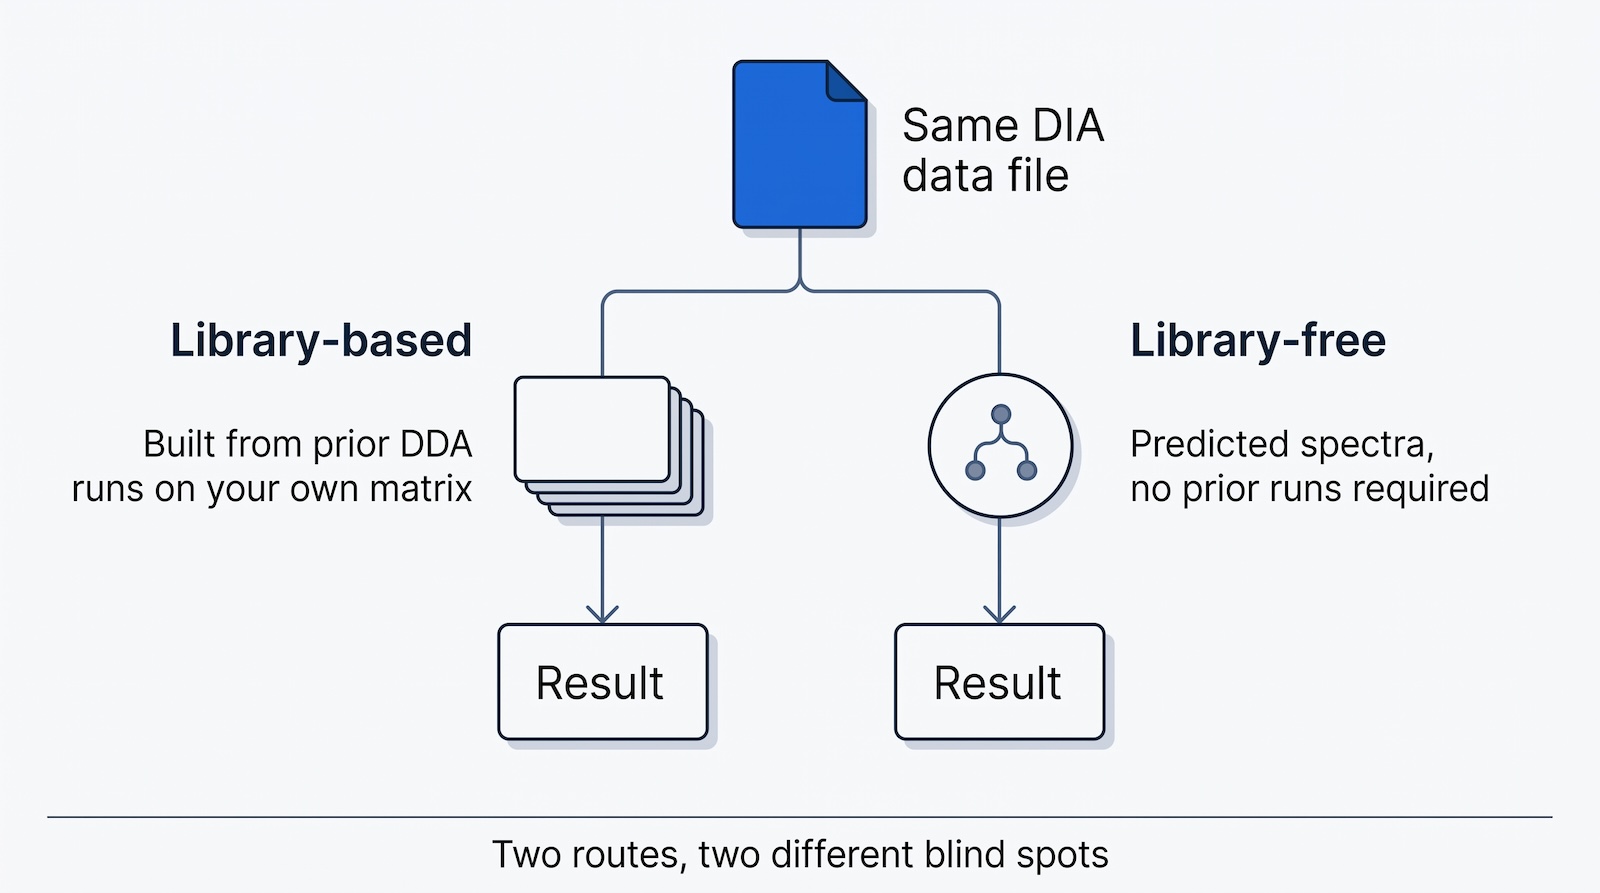
A spectral library is a reference table of peptides with their expected fragment ions, relative fragment intensities and normalized retention times. DIA processing uses it as a target list: for each entry the software extracts fragment ion chromatograms at the expected retention time and scores how well the observed peak group matches. Libraries come from DDA runs on the same or related material (usually fractionated on a long gradient), from synthetic peptides, or from in silico prediction against a FASTA database. Library-free, or directDIA, processing applies that last case directly, as in DIA-NN (Demichev et al., 2020).
A library that lacks a protein guarantees you will not report it, and absent entries generate no warning, so library mismatch is the most common silent failure in DIA HCP analysis. Guo et al. recommend comprehensive libraries “for medium- to large-sized sample data sets, such as null strain fermentations” and “a smaller sample-specific library” for purified samples. Library-free processing removes that blind spot and the DDA library run, which in the AAV study halved sample consumption, with Leibiger et al. reporting “no statistically significant change to the protein quantitation CV across triplicate injections for the two spectral libraries, with median CV remaining below 10% in all cases.” The burden then shifts to the FASTA file: a proteome that omits your expression construct or common contaminants recreates the same blind spot.
False discovery rate at peptide and protein level
False discovery rate (FDR) is the expected proportion of reported identifications that are incorrect, usually estimated by searching a decoy database alongside the real one (see our primer on p-values, FDR and q-values). Protein-level FDR is the harder problem, and harder still in an HCP sample.
Protein-level error accumulates from peptide-level error in proportion to how few peptides support each protein, and in a purified drug product an HCP may rest on one or two peptides at the edge of detection. Guo et al. warn that “the accuracy of FDR estimation is greatly diminished and exceedingly optimistic for very small datasets (e.g., < 20 identifications), which are of particular interest for final product HCP samples.” Error also compounds across runs: Rosenberger et al. (2017) in Nature Methods showed that a per-file threshold lets false positives accumulate as run counts grow, so a per-run 1% FDR across a 60-injection stability study is not a 1% experiment-wide FDR. Ludwig et al. put the requirement plainly: control FDR “at the protein level, rather or in addition to the peptide level” and compute it “globally for a complete experiment rather than at the per-file level.”
USP General Chapter <1132.1> covers the same ground in its Section 4.4 Data Analysis, and it is worth knowing what it says before you set a threshold, because it is more cautious than most software defaults. It observes that search engines were developed for proteomics generally, that HCP work pushes them down to low-abundance peptides with poorer signal to noise, and that a user should expect some false positives. It states that “search engine output should not be trusted implicitly” (USP <1132.1>, Section 4.4), especially for low-abundance HCPs. It discusses typical false discovery rate settings and describes 1% as more conservative than 2% or 5%. And it describes two unique peptides as common practice for a confident identification, with extra confirmatory work expected where an identification rests on a single peptide.
The chapter also treats manual inspection as routine rather than exceptional: looking at the peptide-level raw data, the extracted ion chromatogram trace, the MS spectrum and the MS/MS spectrum, should be a normal part of HCP data analysis, and it is most insistent about that for low-abundance HCPs and for drug substance samples. In practice that is a software requirement rather than a discipline problem. If getting from a protein in a result table to its extracted ion chromatogram takes six clicks and a file export, nobody will do it on every low-level identification, and the chapter’s expectation quietly stops being met.
On the database, Section 4.4 is prescriptive in a way that is easy to comply with and easy to forget. Set the protein sequence database at the start of the project and do not change it; if it has to change, document the change. Include the product protein sequence. Include the digestion reagents and any spiked-in proteins. Include common contaminants. Avoid unnecessarily large databases, because search space costs you sensitivity and FDR control. And use a decoy strategy. Every one of those is a recorded setting, which means every one of them is something a reviewer can ask you to produce two years later.
The convention of two unique peptides per protein at 1% to 5% FDR was designed for populations of thousands of proteins. For a drug product with a handful of surviving HCPs, Guo et al. instead recommend “using a less stringent FDR cutoff such as 5 or 10% and reviewing identifications manually for false positive identifications case-by-case.” That only works if your software makes manual review fast.
Interference and why you have to look at the chromatograms
Interference is signal from a different precursor, one that shared the isolation window and the retention time, appearing inside an extracted fragment ion chromatogram. It is the characteristic DIA failure mode, worst where the co-eluting background is largest, which in an HCP sample means wherever the product elutes. Modern DIA engines model and subtract interference, one of the two capabilities named in the DIA-NN paper. That reduces the problem; it does not remove it.
For a low-level HCP identification that will appear in a report, the check that matters is visual: do the fragment traces co-elute at the same apex, in the intensity ratios the library predicts, with a peak shape consistent with the rest of the run? Targeted proteomics software such as Skyline (MacLean et al., 2010) established this inspection workflow, and the same discipline applies to DIA peak groups. A protein that survives scoring but shows one dominant fragment and three flat traces is an artifact, not an impurity, which is one reason visual quality control of the LC-MS run belongs upstream of the protein list.
Shared peptides, protein groups and razor peptides
A shared peptide is a sequence present in more than one protein in the search database. Assigning it is the protein inference problem described by Nesvizhskii and Aebersold (2005). Proteins that cannot be distinguished by the peptides observed are reported as a protein group; a razor peptide is a shared peptide assigned to a single protein, conventionally the group with the most supporting evidence, so its intensity is counted once instead of twice. Protein families with high sequence identity are common in CHO and HEK293, so quantify on unique peptides where you can, know whether your software counts razor peptide intensity toward the protein you report, since the same data gives different ppm values under different conventions (one reason ELISA and LC-MS HCP numbers disagree and a factor in Hi3 label-free peptide quantification), and report the protein group rather than the top accession when the evidence does not separate the members.
| Problem | Typical cause | What to do |
|---|---|---|
| A low-level HCP appears in one replicate only | Score sits near the decision boundary; interference is inflating or suppressing the peak group in individual runs | Inspect extracted fragment ion chromatograms in all replicates. Require co-elution and correct fragment ratios before reporting. Consider a narrower isolation window across that m/z region |
| Implausible high-abundance HCP in a highly purified sample | Interference from a co-eluting product peptide in the same isolation window, or a shared peptide assigned to the wrong protein group | Check whether quantification rests on unique or razor peptides. Re-extract with a narrower window. Confirm by PRM if the protein is on the high-risk list |
| Protein list is shorter than expected and known HCPs are absent | Spectral library or FASTA does not contain those proteins, or the library came from a different host line, clone or process step | Verify library provenance. Add the expression construct and common contaminants to the FASTA. Test the same data with library-free processing as a cross-check |
| ppm values drift between batches with no process change | Digestion efficiency is varying, or normalization is anchored to a peptide set that is itself changing | Include digestion control peptides and a system suitability injection. Review missed cleavage rates per run before accepting the quantitative result |
| Very few peptides per protein, most with missed cleavages | Incomplete digestion, often from the product protein dominating the enzyme-to-substrate ratio, or from denaturation and reduction conditions | Optimize digestion time, enzyme ratio and denaturation. Confirm with a spiked standard protein digested in the same matrix |
| Protein-level FDR looks fine but reviewers challenge single-peptide identifications | Protein FDR estimated per run on a very small identification set | Apply experiment-wide FDR control, report the peptide evidence for each HCP, and manually verify single-peptide identifications |
| Peak shapes are poor and quantification CVs rise | Cycle time too long for the chromatographic peak width, giving too few points across the peak | Reduce the number of windows, widen them, or lengthen the gradient until you have at least 8 to 10 points across an average peak |

Targeted follow-up: DIA discovers, PRM and MRM confirm
Once DIA flags a specific HCP as a risk, switch to a targeted method for that protein. DIA is the discovery and monitoring layer; targeted mass spectrometry is the confirmation layer. Ludwig et al. note that peptide quantification by SWATH-MS is “three- to 10-fold less sensitive” than classical targeted approaches, and conclude that “targeted data acquisition remains the better option for projects that involve quantification of particularly low-abundant proteins and peptides with maximal accuracy.” MRM monitors three to five transitions per peptide; PRM records the full fragment spectrum per target, which Guo et al. call “highly specific.” Both become absolute against stable isotope labeled internal standards, using at least two peptides per protein. Kreimer et al. (2017) in Analytical Chemistry published this two-stage pattern: HCP profiling from DIA data, with PRM verification.
A workable sequence:
- Run DIA on the sample set, quantifying HCPs across batches and process steps.
- Filter for risk: immunogenicity, protease or lipase activity, product-degrading potential, persistence through purification.
- Select two or more unique peptides per candidate, avoiding missed cleavage sites, methionine and known modification sites, and order stable isotope labeled versions.
- Build and qualify a PRM or MRM assay for that short list, with its own linearity, precision and accuracy data.
- Keep DIA running as the monitoring layer. A targeted assay cannot find what is not on its list.
Instrument settings that change the answer
Three DIA parameters interact and cannot be optimized independently: isolation window width, cycle time and gradient length.
Narrow isolation windows (4 to 10 m/z) admit fewer precursors, giving cleaner MS2 spectra, less interference and better low-level sensitivity. Wide windows (25 m/z in the original SWATH implementation) cover the mass range in fewer steps. Variable window schemes stay narrow where precursor density is highest and widen where it is sparse, which is why they are now the default in HCP methods. But halving the window width doubles the window count, and therefore the cycle time, at constant fill time. Cycle time sets how many points you get across a chromatographic peak, and Ludwig et al. state that “ten recorded data points are considered necessary for accurate reconstruction of a chromatographic peak,” which for the original 32-window, 3.3 second cycle means “the average chromatographic peak width in SWATH-MS measurements should not fall below 20-40 s.” Gradient length is the release valve, since a longer gradient widens peaks at the cost of throughput; Ludwig et al. report that 30 to 60 minute gradients “still provide results with good selectivity and proteome coverage at a significantly higher sample throughput,” reserving two-hour gradients for libraries.
The practical rule: fix the gradient at what your throughput allows, measure median peak width at half height, then take the largest number of windows whose cycle time still gives 8 to 10 points across that peak. Faster instruments move where this balance lands; the constraint itself is arithmetic, not vendor specific.
Where DDA is still the right choice
DDA has not been superseded. Building spectral libraries is its clearest use: for an experimental library rather than a predicted one, DDA on fractionated null-cell or upstream material with a long gradient is how you build it, because clean single-precursor MS2 spectra are what a library wants. High-abundance samples are the second: harvest cell culture fluid, clarified bulk and early chromatography pools hold thousands of HCPs at high abundance, no single protein dominates the survey scan, and top-N selection samples the population reasonably. Identification-only questions are the third, and DDA spectra are simpler to interpret by hand when troubleshooting. What DDA should not be asked to do is produce reproducible quantitative values for trace HCPs across batches over time.
What companies were actually running in 2020
The BioPhorum Development Group HCP Workstream surveyed its 26 member companies and 18 responded. Among them, mass spectrometry acquisition mode split evenly: 6 respondents used DDA and 6 used DIA [20]. Around 64% reported relative rather than absolute quantitation, and roughly 67% did not enrich for HCPs before analysis [20].
Read that as a dated snapshot, not a trend line. It says that by 2020, among the companies doing individual HCP work at all, DIA was already at parity with DDA rather than being a specialist option. It does not say DIA has since overtaken DDA, and this page does not claim that; the survey was a single point in time with a small denominator, and no equivalent follow-up has been published. What the snapshot does support is the narrower point made above: the two acquisition modes are both in routine use, and the choice between them is made per question rather than per laboratory. However, if you want to future-proof your analysis, TotalLab’s SpotMap MS HCP analysis software supports both DIA and DDA acquisition modes harmonizing your lab around one piece of software regardless of your methodology.
Bringing the analysis layer in-house
The acquisition decision is usually settled quickly. The analysis decision is where laboratories stall, because DIA HCP processing needs library management, experiment-wide FDR control, protein inference you can explain, fast visual verification of fragment ion chromatograms, and an audit trail. Open-source tools do the science but are not built for GMP, which is why many teams weigh them against validated proteomics software and our LC-MS HCP software comparison.
SpotMap MS, TotalLab’s LC-MS HCP analysis software, is built on data-independent acquisition or data-dependent acquisition and takes raw DIA or DDA traces plus a user-supplied FASTA file through identification, threat-level assignment and reporting, with a protein verification loop for peptide-level inspection. If you are weighing in-house analysis against outsourcing, start with bringing HCP analysis in-house and the LC-MS HCP analysis pillar, or, for AAV and gene therapy, residual protein analysis for AAV and gene therapy
Try it on your own data
Run SpotMap MS against your own DIA or DDA traces and FASTA files during a free trial, or contact TotalLab for a demonstration.
Frequently asked questions
Is DIA better than DDA for host cell protein analysis?
For routine, quantitative HCP measurement, yes. DIA fragments every precursor in each m/z window, so the same peptides are sampled in every injection. DDA selects precursors by intensity, and in a purified product the survey scan is dominated by product peptides, so trace HCPs are missed unpredictably. In a published comparison, DIA identified 146 HCPs in monoclonal antibody drug products where top-five DDA identified 8.
Do I need a spectral library for DIA HCP analysis?
No. You can process DIA data library-free, sometimes called directDIA, where the software predicts a library from your FASTA file. A 2025 AAV study found an in silico library gave a small increase in protein identifications versus a project-specific DDA library, with median quantitation CV below 10% in both cases, while halving sample consumption. If you do use an experimental library, make sure it came from the same host line and process context.
What is SWATH?
SWATH-MS, sequential window acquisition of all theoretical fragment ion spectra, is SCIEX’s implementation of data-independent acquisition, published by Gillet and colleagues in 2012. The original method used 32 consecutive, slightly overlapping 25 m/z isolation windows with a cycle time of about 3.3 seconds. All SWATH is DIA. Not all DIA is SWATH, since other vendors have their own DIA implementations with different window schemes.
Why do I get missing values in DDA host cell protein data?
Because DDA picks what to fragment in real time, based on intensity in the survey scan. A 1 ppm HCP peptide has to out-compete co-eluting product peptides that are orders of magnitude more abundant, and whether it does is partly chance. The result differs in every injection. One benchmarking study reported over 50% of peptides dropping out of DDA at low spike levels while DIA held coverage.
Does USP <1132.1> require DIA?
No. Section 4.3 describes both modes and prescribes neither. It is not neutral about their behavior, though. It notes that DDA precursor selection is limited by instrument speed and elution time, that low-abundance HCP peptides can be missed, and that the selection can be stochastic and vary from one injection to the next, so low-abundance peptides may not be detected consistently in replicates. For DIA it notes the advantage that MS/MS data are collected for everything all the time, and the disadvantage that the spectra are complex and coeluting peptides can interfere.
How do MRM and PRM fit alongside DIA?
They are the confirmation layer. Once DIA flags a high-risk HCP, build a targeted PRM or MRM assay for two or more unique peptides from that protein, with stable isotope labeled internal standards. Targeted methods are roughly three to ten times more sensitive per analyte than SWATH-MS and give the best quantitative precision. Keep DIA running as the monitoring layer, because a targeted assay cannot find proteins that are not on its list.
Why is protein-level FDR harder than peptide-level FDR in HCP samples?
Because purified drug products yield very few HCP identifications, often supported by one or two peptides each. FDR estimation from decoy searching becomes unreliable and optimistic on small result sets, and error accumulates across runs if FDR is controlled per file rather than experiment-wide. USP <1132.1> Section 4.4 discusses typical FDR settings, describes 1% as more conservative than 2% or 5%, names two unique peptides as common practice for a confident identification, and tells the user to expect some false positives and to inspect low-abundance identifications manually rather than trusting search engine output implicitly.
How narrow should my DIA isolation windows be?
Narrow enough to reduce interference, wide enough that cycle time still gives 8 to 10 data points across an average chromatographic peak. Set your gradient first, measure median peak width at half height, then choose the window count that fits. Variable-width windows, narrow where precursor density is high and wider where it is sparse, are the usual compromise in HCP methods.
References
- Gillet LC, Navarro P, Tate S, Röst H, Selevsek N, Reiter L, Bonner R, Aebersold R. “Targeted Data Extraction of the MS/MS Spectra Generated by Data-independent Acquisition: A New Concept for Consistent and Accurate Proteome Analysis.” Molecular & Cellular Proteomics 11(6):O111.016717, 2012. https://doi.org/10.1074/mcp.O111.016717
- Ludwig C, Gillet L, Rosenberger G, Amon S, Collins BC, Aebersold R. “Data-independent acquisition-based SWATH-MS for quantitative proteomics: a tutorial.” Molecular Systems Biology 14:e8126, 2018. https://link.springer.com/article/10.15252/msb.20178126
- Rosenberger G, Bludau I, Schmitt U, et al. “Statistical control of peptide and protein error rates in large-scale targeted data-independent acquisition analyses.” Nature Methods 14:921-927, 2017. https://www.nature.com/articles/nmeth.4398
- Demichev V, Messner CB, Vernardis SI, Lilley KS, Ralser M. “DIA-NN: neural networks and interference correction enable deep proteome coverage in high throughput.” Nature Methods 17:41-44, 2020. https://www.nature.com/articles/s41592-019-0638-x
- Guo J, Kufer R, Li D, Wohlrab S, Greenwood-Goodwin M, Yang F. “Technical advancement and practical considerations of LC-MS/MS-based methods for host cell protein identification and quantitation to support process development.” mAbs 15(1), 2023. https://pmc.ncbi.nlm.nih.gov/articles/PMC10208169/
- Leibiger TM, Min L, Lee KH. “A comparison of SWATH-MS methods for measurement of residual host cell proteins in adeno-associated virus preparations.” Frontiers in Bioengineering and Biotechnology 13, 2025. https://www.frontiersin.org/journals/bioengineering-and-biotechnology/articles/10.3389/fbioe.2025.1579098/full
- Strasser L, Oliviero G, Jakes C, Zaborowska I, Floris P, Ribeiro da Silva M, Füssl F, Carillo S, Bones J. “Detection and quantitation of host cell proteins in monoclonal antibody drug products using automated sample preparation and data-independent acquisition LC-MS/MS.” Journal of Pharmaceutical Analysis 11(6), 2021. https://pmc.ncbi.nlm.nih.gov/articles/PMC8740166/
- Khalil S, Plisnier M. “Definitive benchmarking of DDA and DIA for host cell protein analysis on the Orbitrap Astral in a regulatory-aligned framework.” bioRxiv preprint, 2025. https://www.biorxiv.org/content/10.1101/2025.07.31.667876v1.full
- Kreimer S, Gao Y, Ray S, Jin M, Tan Z, Mussa NA, Tao L, Li Z, Ivanov AR, Karger BL. “Host Cell Protein Profiling by Targeted and Untargeted Analysis of Data Independent Acquisition Mass Spectrometry Data with Parallel Reaction Monitoring Verification.” Analytical Chemistry 89(10):5294-5302, 2017. https://doi.org/10.1021/acs.analchem.6b04892
- Peterson AC, Russell JD, Bailey DJ, Westphall MS, Coon JJ. “Parallel Reaction Monitoring for High Resolution and High Mass Accuracy Quantitative, Targeted Proteomics.” Molecular & Cellular Proteomics 11(11):1475-1488, 2012. https://doi.org/10.1074/mcp.O112.020131
- Lange V, Picotti P, Domon B, Aebersold R. “Selected reaction monitoring for quantitative proteomics: a tutorial.” Molecular Systems Biology 4:222, 2008. https://link.springer.com/article/10.1038/msb.2008.61
- Nesvizhskii AI, Aebersold R. “Interpretation of Shotgun Proteomic Data: The Protein Inference Problem.” Molecular & Cellular Proteomics 4(10):1419-1440, 2005. https://doi.org/10.1074/mcp.R500012-MCP200
- MacLean B, Tomazela DM, Shulman N, Chambers M, Finney GL, Frewen B, Kern R, Tabb DL, Liebler DC, MacCoss MJ. “Skyline: an open source document editor for creating and analyzing targeted proteomics experiments.” Bioinformatics 26(7):966-968, 2010. https://doi.org/10.1093/bioinformatics/btq054
- International Council for Harmonisation. “ICH Harmonised Guideline: Validation of Analytical Procedures Q2(R2).” Adopted 1 November 2023. https://database.ich.org/sites/default/files/ICH_Q2(R2)_Guideline_2023_1130.pdf
- USP-NF. “General Chapter <1132.1> Residual Host Cell Protein Measurement in Biopharmaceuticals by Liquid Chromatography-Mass Spectrometry.” Notice of intent to revise, 1 November 2024. https://www.uspnf.com/notices/gc-1132-1-nitr-20241101
- Esser-Skala W, Wohlschlager T, Huber CG. “In Search of The Needle in The Mariana Trench: Host Cell Proteins and the Problem of Dynamic Range.” LCGC, 9 October 2020. https://www.chromatographyonline.com/view/in-search-of-the-needle-in-the-mariana-trench-host-cell-proteins-and-the-problem-of-dynamic-range
- United States Pharmacopeial Convention. “General Chapter <1132> Residual Host Cell Protein Measurement in Biopharmaceuticals.” USP 39 and NF 34, official 1 May 2016. Free full-text PDF posted by USP. Note that this free copy is the 2016 version and that no Notice of Intent to Revise has been published for <1132> since it became official. Source for the LC-MS/MS detection limit range and the <1 to 100 ng/mg product level range. https://www.usp.org/sites/default/files/usp/document/our-work/biologics/USPNF810G-GC-1132-2017-01.pdf
- Blaszczyk A, Peckham N (United States Pharmacopeia). “USP Unpacks The Evolving HCP Identification And Quantitation Story Behind <1132.1>.” BioProcess Online, 18 August 2023. https://www.bioprocessonline.com/doc/usp-unpacks-the-evolving-hcp-identification-and-quantitation-story-behind-0001
- United States Pharmacopeial Convention. General Chapter <1132.1> Residual Host Cell Protein Measurement in Biopharmaceuticals by Liquid Chromatography-Mass Spectrometry. USP-NF, official 1 May 2025. DOI 10.31003/USPNF_M17756_03_01. Subscription access. Sections used on this page: 4.3 (Mass Spectrometry Analysis, for the DDA and DIA descriptions and the dynamic range framing), 4.4 (Data Analysis, for search engine confidence, FDR settings, manual inspection, the two-unique-peptides convention and the database guidance) and 5.3 (System Suitability). https://doi.usp.org/USPNF/USPNF_M17756_02_01.html
- Jones, M., Palackal, N., Wang, F., Gaza-Bulseco, G., Hurkmans, K., Zhao, Y., Chitikila, C., Clavier, S., Liu, S., Menesale, E., Schonenbach, N.S., Sharma, S., Valax, P., Waerner, T., Zhang, L., Connolly, T. “‘High-risk’ host cell proteins (HCPs): A multi-company collaborative view.” Biotechnology and Bioengineering, 118(8):2870-2885, 2021. DOI 10.1002/bit.27808, PMID 33930190. Source for the 2020 BioPhorum survey figures on acquisition mode, quantitation basis and sample enrichment. https://doi.org/10.1002/bit.27808