
Total protein normalization for western blots

Total protein normalization (TPN) corrects a western blot for loading and transfer differences by dividing each target band by all of the protein in its lane, rather than by one housekeeping band such as beta-actin or GAPDH. Because it integrates over hundreds of proteins, no single protein changing with your treatment can distort it, and the summed signal stays proportional to load across a wider range than a single abundant band. A 2017 review of loading controls concluded that it should be the preferred loading control for western blots (ref 1). This guide covers which total protein method to use, what the published comparisons found, how to capture a total protein image that gives a valid number, the calculation, how to do it in Phoretix 1D, and how to report it.
On this page
- Why total protein instead of a housekeeping protein
- Total protein methods compared
- How to capture a valid total protein image
- The calculation
- Total protein normalization in Phoretix 1D
- Mistakes that break total protein normalization
- How to report it in your methods section
- Frequently asked questions
Why total protein instead of a housekeeping protein
Housekeeping normalization assumes two things that often fail. The first is that the reference protein does not change with your treatment. In tissue from a mouse model of spinal muscular atrophy, beta-actin was 19.3% lower than in healthy littermates, so normalizing to it would skew every result by about 20%, and the same study found commonly used controls differing across many tissues and models (ref 5). The second is that the reference band is still in its linear range. Housekeeping proteins are abundant, and a 2017 review of loading controls noted that they commonly fail to show loading differences above small loads of 0.5 to 10 micrograms, which is below the amount most labs load to see a low-abundance target (ref 1). At those loads the housekeeping band saturates, every lane looks equally loaded, and the correction does nothing.
Total protein normalization avoids both problems. It measures the whole lane, so one protein changing does not move the total, and the summed stain signal stays proportional to load across a wider range. In a direct comparison, normalizing to stain-free total protein reduced variability enough to cut the number of samples needed for a statistically significant result by more than half compared with actin or beta-tubulin (ref 2).
Housekeeping normalization is still acceptable when you have validated the control in your system, and the normalization calculator guide shows both calculations side by side. If you are starting a new quantitative project, start with total protein.
Total protein methods compared
There are five common ways to measure total protein in each lane. They differ in when you capture the image, what imager you need, and how well they held up in published comparisons.
| Method | How it works | When you image it | Imager you need | What published comparisons found |
|---|---|---|---|---|
| Stain-free gels | A compound in the gel makes tryptophan-containing proteins fluoresce after UV activation, with no staining step | The gel after the run, and the membrane after transfer and before blocking | UV-capable imager with stain-free imaging | More reliable than GAPDH (ref 3); superior to beta-actin and as good as or better than Ponceau S (ref 4); accurate across membrane types and protein loads (ref 2) |
| Ponceau S | Reversible red stain applied to the membrane after transfer, then washed off | The membrane after transfer and before blocking | White-light imager or flatbed scanner | Comparable to actin (ref 7); best balance of accuracy and precision against actin, GAPDH and Coomassie (ref 8); less accurate than stain-free across loads and membranes (ref 2) |
| Coomassie or Amido Black | Protein stains applied to the membrane, usually after immunodetection, or to a gel run in parallel | The membrane after detection, or the parallel gel | White-light imager or flatbed scanner | Amido Black an acceptable alternative to single-protein controls (ref 6); Coomassie total protein more robust than actin or tubulin (ref 5); Amido Black less accurate across loads (ref 2) |
| Fluorescent total protein stains | Fluorescent dye that binds all protein on the membrane, read in its own channel | The membrane, at the point the stain protocol specifies | Fluorescence imager | SYPRO Ruby an acceptable alternative to single-protein controls (ref 6) |
| Fluorescent prelabeling | Samples are labeled with a dye such as Cy5 before loading, so total protein is in its own channel | With the target, in a separate fluorescence channel | Multichannel fluorescence imager | Variation of 7% against 13% for actin and 18% for tubulin; GAPDH was not proportional to load (ref 9) |
Total protein normalization methods for western blots, when each is imaged, the imager it needs, and what published comparisons found. References are listed at the end of the page.
Which one to choose. If you already run stain-free gels and have a UV-capable imager, use stain-free: it needs no staining step, lets you check separation and transfer before you probe, and was the most accurate across membranes and loads in the most recent comparison (ref 2). If you have a white-light imager or scanner only, Ponceau S costs almost nothing and performed well against actin, GAPDH and Coomassie (refs 7, 8), but check that it stays proportional across your load range. If you image fluorescently, a fluorescent total protein stain or prelabeling puts total protein in its own channel on the same membrane as your targets.
How to capture a valid total protein image
The total protein number is only as good as the image it comes from. Four rules matter more than which stain you use.
Image stain-free and Ponceau S before you block. Both are imaged on the membrane after transfer and before blocking. Blocking proteins coat the membrane, and a total protein image taken after blocking measures the blocking agent as well as your samples.
Keep the total protein image out of saturation. A heavily loaded lane can saturate a total protein image just as it saturates a housekeeping band. Use the longest exposure with no saturated pixels in any lane, the same rule the densitometry guide gives for the target image.
Image the same membrane as the target. Normalization corrects for what happened to that membrane, including uneven transfer. A gel run in parallel corrects only for loading, so use it only when the membrane cannot be stained.
Keep the raw files. Quantify from the original 16-bit TIFF (or your imager’s native file) rather than an exported JPEG, for the total protein image as well as the target.
The calculation
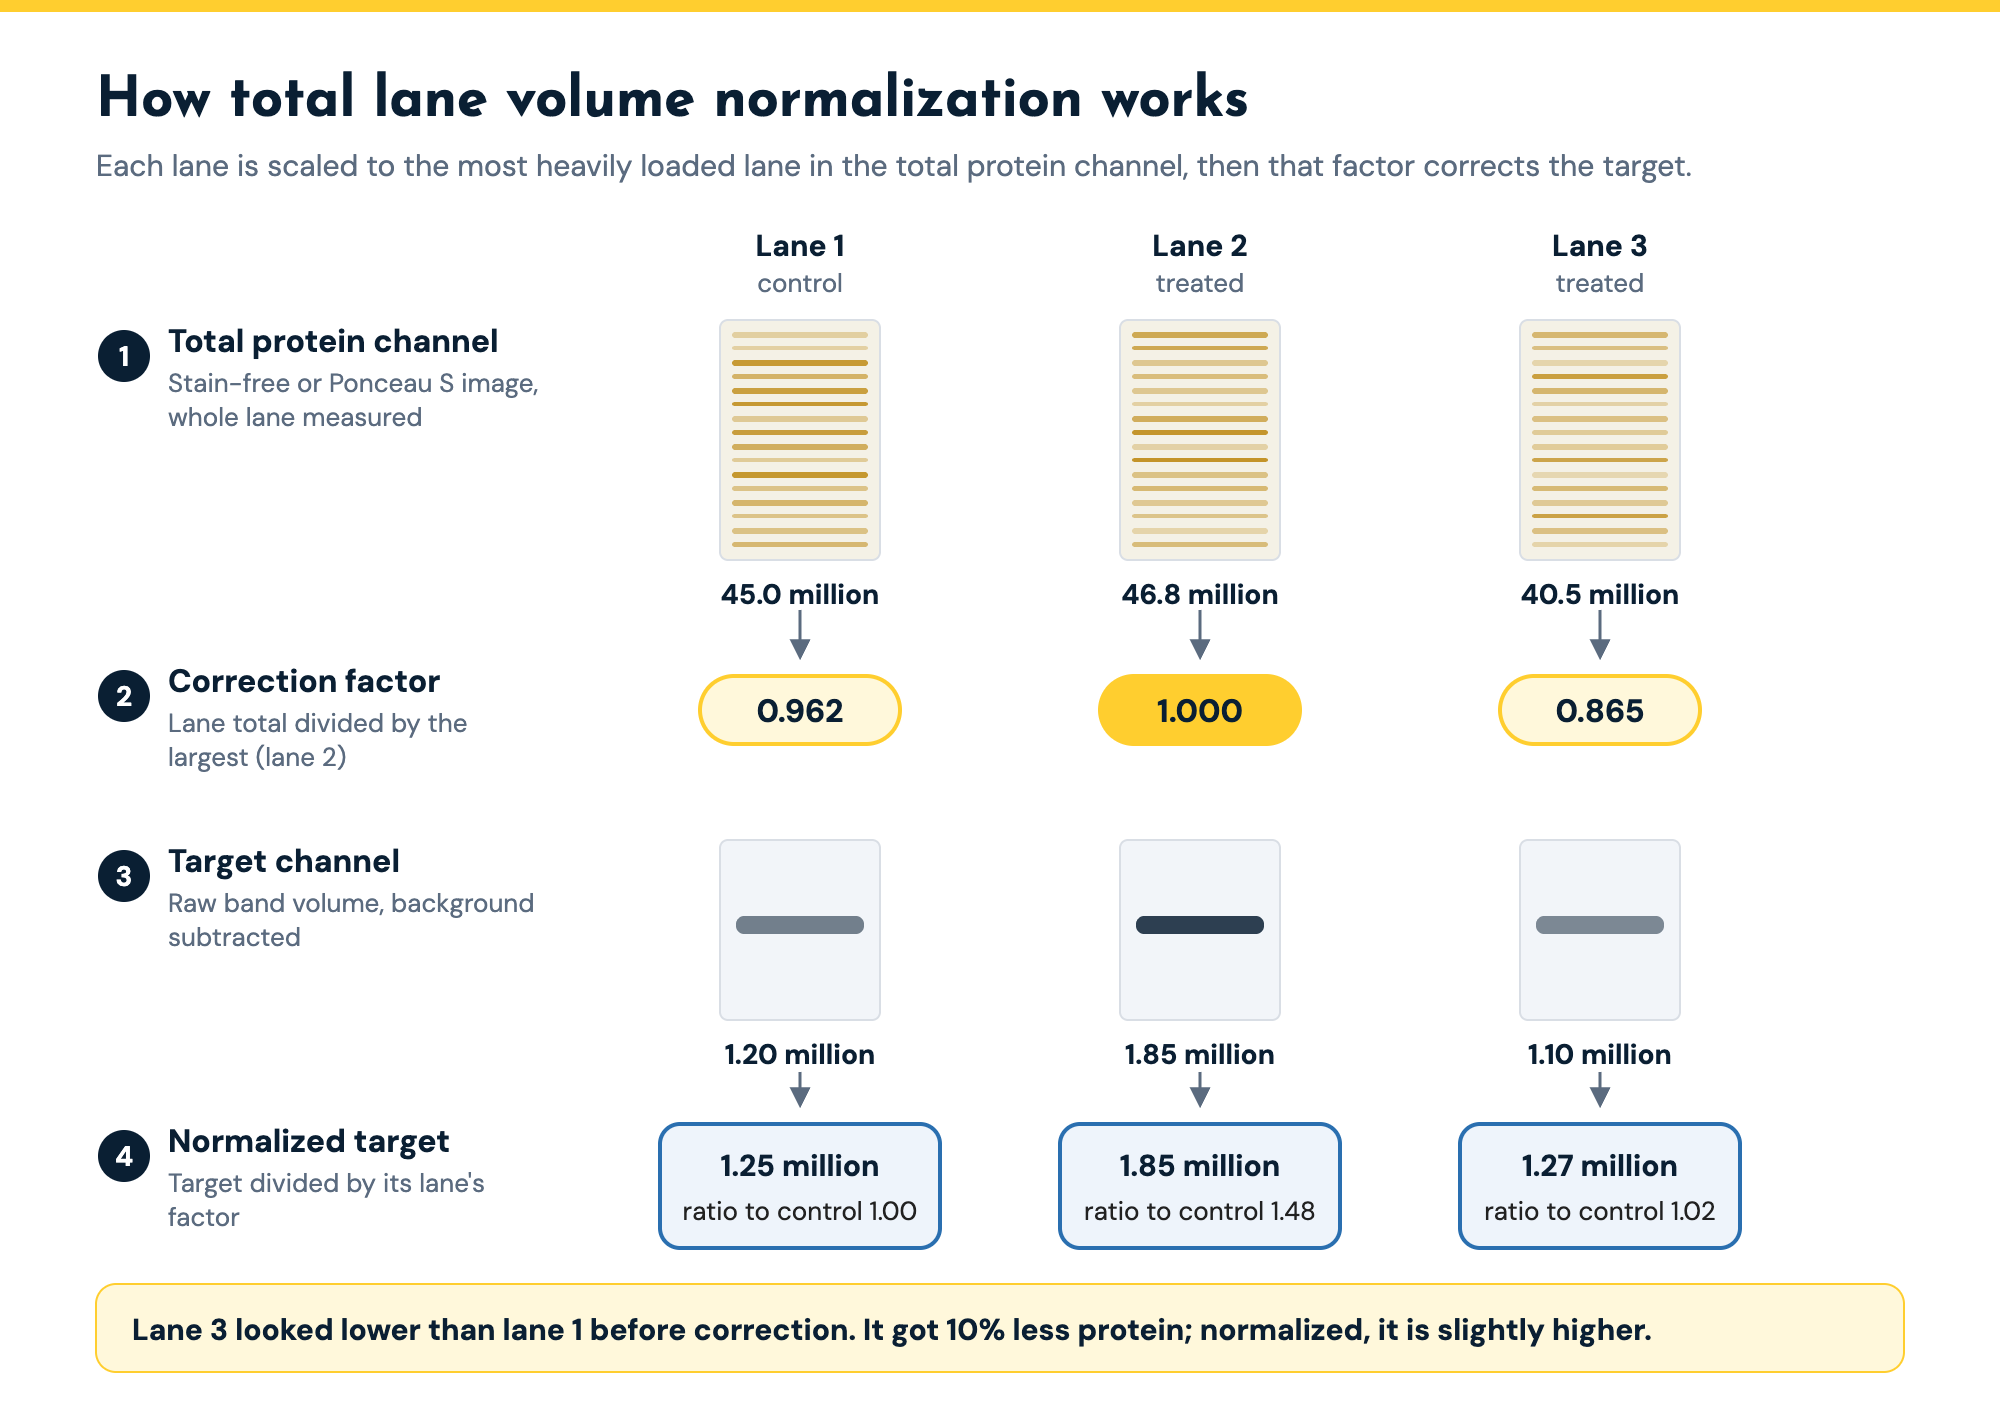
Total protein normalization measures the whole lane in the total protein image as one value, the total lane volume, after background subtraction, using the same lane boundaries as the target. Each lane then gets a correction factor, and the target band is corrected by it.
| Step | Lane 1 (control) | Lane 2 (treated) | Lane 3 (treated) | Note |
|---|---|---|---|---|
| Total lane volume in the total protein image (background subtracted) | 45,000,000 | 46,800,000 | 40,500,000 | Whole lane measured as one value, same lane boundaries as the target |
| Correction factor (lane divided by the most heavily loaded lane) | 0.962 | 1.000 | 0.865 | Lane 2 has the most total protein, so it is the reference |
| Target band volume (background subtracted) | 1,200,000 | 1,850,000 | 1,100,000 | Raw values, before correction |
| Normalized target volume (target divided by factor) | 1,248,000 | 1,850,000 | 1,271,000 | Phoretix 1D reports this in the Volume Norm column |
| Ratio to control (normalized lane divided by normalized lane 1) | 1.00 | 1.48 | 1.02 | Same ratios as dividing each target by its total lane volume |
A worked total protein normalization for three lanes. The most heavily loaded lane (lane 2) sets the reference, each lane’s factor is its total lane volume divided by lane 2’s, and each target band is divided by its lane’s factor.
Lane 3 shows why this matters. Its raw target band is lower than lane 1’s (1.10 million against 1.20 million), which reads as less protein. But lane 3 also received 10% less total protein than lane 1, and after normalization its target is slightly higher (1.27 million against 1.25 million). The ratio to control (lane 2 against lane 1) is 1.48, exactly what the normalization calculator gives for the same values when it divides by total lane volume directly. Scaling to the most heavily loaded lane and dividing by total lane volume give the same ratios; scaling keeps the numbers in the units of your target bands.
Total protein normalization in Phoretix 1D
Phoretix 1D calls total protein normalization “total lane volume” normalization. It works on multichannel images, with your target in one channel and your total protein stain in another, and Phoretix 1D can build that multichannel TIFF from your separate images.
- Combine your images into one multichannel TIFF. If you captured the total protein image (for example stain-free or Ponceau S) and the target image (for example chemiluminescence) as separate files, Phoretix 1D combines them into a single multichannel TIFF for you, with the target and the total protein stain as separate channels. If your imager already saves a multichannel or multiplex TIFF, open it directly.
- Detect lanes. Automatic lane detection places the lanes, including on distorted gels, so the target and total protein are measured over the same lane boundaries.
- Subtract background in each channel. Choose from the eight background subtraction methods, set per lane and per channel.
- Detect bands in the target channel.
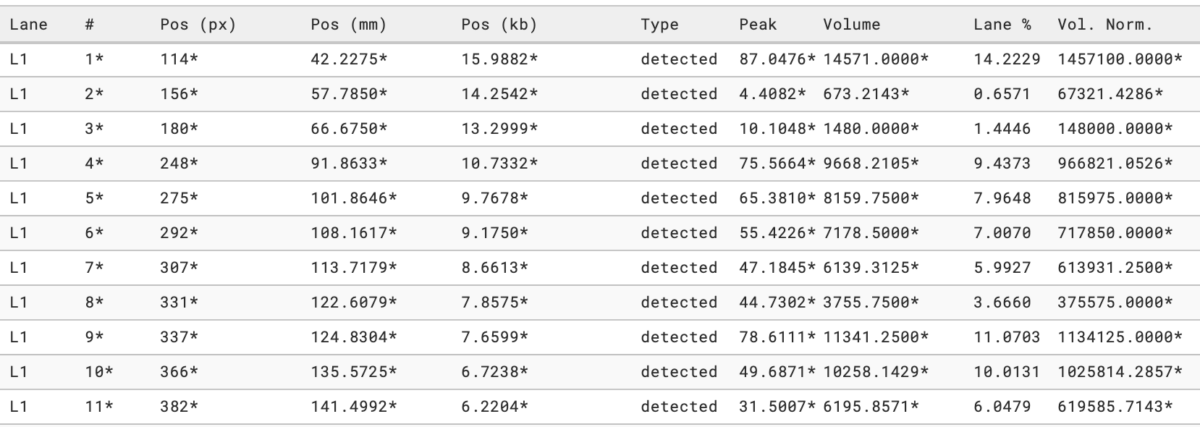
- Choose total lane volume normalization and select the channel that contains your total protein stain as the reference. Phoretix 1D measures every lane in that channel, finds the most intense lane, scales all lanes to it, and applies those factors to the bands in your target channel.
- Export. Normalized volumes appear in the Volume Norm column, ready for CSV export or the PDF report, which records the settings used.
On a single-channel image, Phoretix 1D normalizes to a reference band you select or to the most intense band, and total lane volume normalization is not available. Housekeeping normalization to a band in a second channel is also available on multichannel images.
If your stain-free images come from a Bio-Rad imager, Phoretix 1D opens Bio-Rad .scn files natively, as well as 8-bit and 16-bit TIFF from any imager.
Watch total lane volume normalization in Phoretix 1D, alongside the reference band and housekeeping options, in the video below. The Phoretix 1D normalization guide walks through every normalization mode.

Mistakes that break total protein normalization
Normalizing to one band of the stain. Picking a single prominent band in the total protein image turns it back into a housekeeping control. Use the whole lane.
Including the ladder or empty lanes. The marker lane and empty lanes are not samples. Leave them out of normalization, or the reference lane can end up being the ladder.
Different lanes in the two images. If the lane boxes for the total protein image are narrower, wider or shifted compared with the target, the correction factor no longer describes the lane the target came from. Use the same lane boundaries for both.
Different background treatment. Total lane volume after background subtraction depends on the background method. Apply the same method to every lane, and record it.
A saturated or overexposed stain image. Saturated lanes compress the loading differences you are trying to correct. Check the total protein image for saturation exactly as you check the target.
How to report total protein normalization in your methods section
Name the total protein method, the software and the normalization:
Band intensities were quantified by densitometry using Phoretix 1D version [X] (TotalLab Ltd, Newcastle upon Tyne, UK) with [rolling ball] background subtraction and normalized to total protein in the same lane, measured from the [stain-free gel / Ponceau S stained membrane] image as total lane volume.
Show the total protein image with your blot, in the figure or the supplement, so reviewers can see the loading. The densitometry guide has the full reporting checklist.
Normalize to total protein without a spreadsheet
Open your target and total protein images in a free Phoretix 1D trial, select the total protein channel as the reference, and export normalized volumes and a PDF report of your settings.
Frequently asked questions
Q: What is total protein normalization in western blotting?
A: Total protein normalization corrects each target band for loading and transfer differences by dividing it by the total protein in the same lane, measured from a stain-free gel, a stained membrane or a fluorescent total protein channel, instead of by a single housekeeping protein such as beta-actin or GAPDH.
Q: Is total protein normalization better than beta-actin or GAPDH?
A: For most quantitative blots, yes. Housekeeping proteins can change with treatment and often saturate at the loads used to detect low-abundance targets, while total protein integrates over the whole lane and stays proportional to load across a wider range. Housekeeping normalization remains acceptable when the control has been validated in your system.
Q: Stain-free or Ponceau S: which is better for total protein normalization?
A: Both outperformed housekeeping proteins in published comparisons. Stain-free was more accurate across membrane types and protein loads in a 2022 comparison, and needs no staining step, but requires stain-free gels and a UV-capable imager. Ponceau S is inexpensive and works with a white-light imager or scanner; check that it stays proportional across your load range.
Q: Can I use total protein normalization with chemiluminescent detection?
A: Yes. Capture the total protein image (stain-free or Ponceau S) of the membrane before blocking, then capture the chemiluminescent target image, and quantify both over the same lanes. Phoretix 1D combines the two files into one multichannel TIFF, so you can normalize the chemiluminescent target to the total protein channel.
Q: How do I calculate total protein normalization?
A: Measure the total lane volume of every lane in the total protein image after background subtraction, divide each by the largest to get a correction factor, and divide each target band by its lane’s factor. The ratio to control is then the normalized treated value divided by the normalized control value.
Q: How do I do total protein normalization in Phoretix 1D?
A: Combine your target and total protein images into one multichannel TIFF (Phoretix 1D does this for you), detect lanes and bands, subtract background, then choose total lane volume normalization and select the total protein channel as the reference. Normalized volumes appear in the Volume Norm column for export.
References
- Moritz CP. Tubulin or not tubulin: heading toward total protein staining as loading control in western blots. Proteomics. 2017;17(20). doi:10.1002/pmic.201600189
(Source for: total protein staining recommended as the preferred loading control; housekeeping proteins commonly fail to show loading differences above 0.5 to 10 micrograms.) - Maloy A, Alexander S, Andreas A, Nyunoya T, Chandra D. Stain-Free total-protein normalization enhances the reproducibility of Western blot data. Anal Biochem. 2022;654:114840. doi:10.1016/j.ab.2022.114840
(Source for: stain-free accurate across membranes and loads, unlike Ponceau S and Amido Black; more than 50% fewer samples needed than with actin or beta-tubulin.) - Gürtler A, Kunz N, Gomolka M, et al. Stain-Free technology as a normalization tool in Western blot analysis. Anal Biochem. 2013;433(2):105-11. doi:10.1016/j.ab.2012.10.010
(Source for: stain-free more reliable, robust and sensitive to small effects than GAPDH normalization.) - Gilda JE, Gomes AV. Stain-Free total protein staining is a superior loading control to beta-actin for Western blots. Anal Biochem. 2013;440(2):186-8. doi:10.1016/j.ab.2013.05.027
(Source for: stain-free superior to beta-actin and as good as or better than Ponceau S.) - Eaton SL, Roche SL, Llavero Hurtado M, et al. Total protein analysis as a reliable loading control for quantitative fluorescent Western blotting. PLoS One. 2013;8(8):e72457. doi:10.1371/journal.pone.0072457
(Source for: beta-actin 19.3% lower in an SMA model, skewing data by about 20%; differential expression of common controls across tissues; Coomassie total protein more robust.) - Aldridge GM, Podrebarac DM, Greenough WT, Weiler IJ. The use of total protein stains as loading controls: an alternative to high-abundance single-protein controls in semi-quantitative immunoblotting. J Neurosci Methods. 2008;172(2):250-4. doi:10.1016/j.jneumeth.2008.05.003
(Source for: GAPDH and beta-actin do not reflect loading differences at normal loads; SYPRO Ruby and Amido Black acceptable alternatives.) - Romero-Calvo I, Ocón B, Martínez-Moya P, et al. Reversible Ponceau staining as a loading control alternative to actin in Western blots. Anal Biochem. 2010;401(2):318-20. doi:10.1016/j.ab.2010.02.036
(Source for: Ponceau S densitometry comparable to actin.) - Thacker JS, Yeung DH, Staines WR, Mielke JG. Total protein or high-abundance protein: which offers the best loading control for Western blotting? Anal Biochem. 2016;496:76-8. doi:10.1016/j.ab.2015.11.022
(Source for: Ponceau S best balance of accuracy and precision against actin, GAPDH and Coomassie.) - Hagner-McWhirter Å, Laurin Y, Larsson A, Bjerneld EJ, Rönn O. Cy5 total protein normalization in Western blot analysis. Anal Biochem. 2015;486:54-61. doi:10.1016/j.ab.2015.06.017
(Source for: prelabeling CV 7% against 13% for actin and 18% for tubulin; GAPDH not proportional.) - Posch A, Kohn J, Oh K, Hammond M, Liu N. V3 stain-free workflow for a practical, convenient, and reliable total protein loading control in western blotting. J Vis Exp. 2013;(82):50948. doi:10.3791/50948
(Source for: stain-free lets you check separation and transfer, and removes the need to strip and reprobe for a housekeeping protein.) - TotalLab. Total Protein Normalization for Western Blots (video, v1aKfBhAP34) and Phoretix 1D normalization guide, https://totallab.com/resources/western-blot-1d-gel-normalization/
(Source for: total lane volume mode on multichannel images; combining separate images into a multichannel TIFF confirmed by the TotalLab product team, October 2026; reference channel, scaling to the most intense lane, Volume Norm column, single-channel options.)