
Phoretix 1D vs ImageJ for western blot densitometry

ImageJ is free, it runs everywhere, and it can quantify a western blot. That is why so many methods sections name it. It also asks you to draw every lane, every baseline and every peak by hand, and then to finish the calculation in a spreadsheet. Phoretix 1D by TotalLab does the same densitometry with automatic lane and band detection, eight background methods applied the same way to every lane, and normalization built in. This page shows how western blot quantification works in ImageJ step by step, where the results start to depend on who did the analysis, and when it is worth moving to dedicated software.
How to quantify a western blot in ImageJ, step by step
This is the standard route through ImageJ’s built-in gel tools (Analyze > Gels). Fiji, the ImageJ distribution most labs install, has the same tools.
- Open the raw image from your imager, ideally an uncompressed 16-bit TIFF, never a JPEG or a screenshot. Many protocols invert the image first (Edit > Invert) so the bands are dark on a light background.
- Optionally remove background with Process > Subtract Background, which uses a rolling ball. Set the radius larger than your widest band. Many users skip this and draw baselines under each peak in step 6 instead.
- Choose the rectangle tool, draw a box around the first lane and select Analyze > Gels > Select First Lane.
- Drag the same box to the next lane and select Analyze > Gels > Select Next Lane. Repeat for every lane. ImageJ requires every lane rectangle to have the same dimensions.
- Select Analyze > Gels > Plot Lanes. ImageJ draws a profile for each lane, with each band as a peak.
- Use the straight line tool to draw a baseline under each peak, and drop lines between neighboring peaks, so that each peak is a closed area.
- Click inside each peak with the wand tool. ImageJ records the area, which is the band’s intensity in arbitrary units.
- Copy the areas into a spreadsheet. Divide each target band by its loading control from the same lane, then divide by the control lane’s value to get the ratio to control.
For a lane or two on a clean blot, this works. The western blot normalization calculator does step 8 for you: enter the target and loading-control intensities and it returns the normalized values and ratio to control.

Where ImageJ densitometry goes wrong
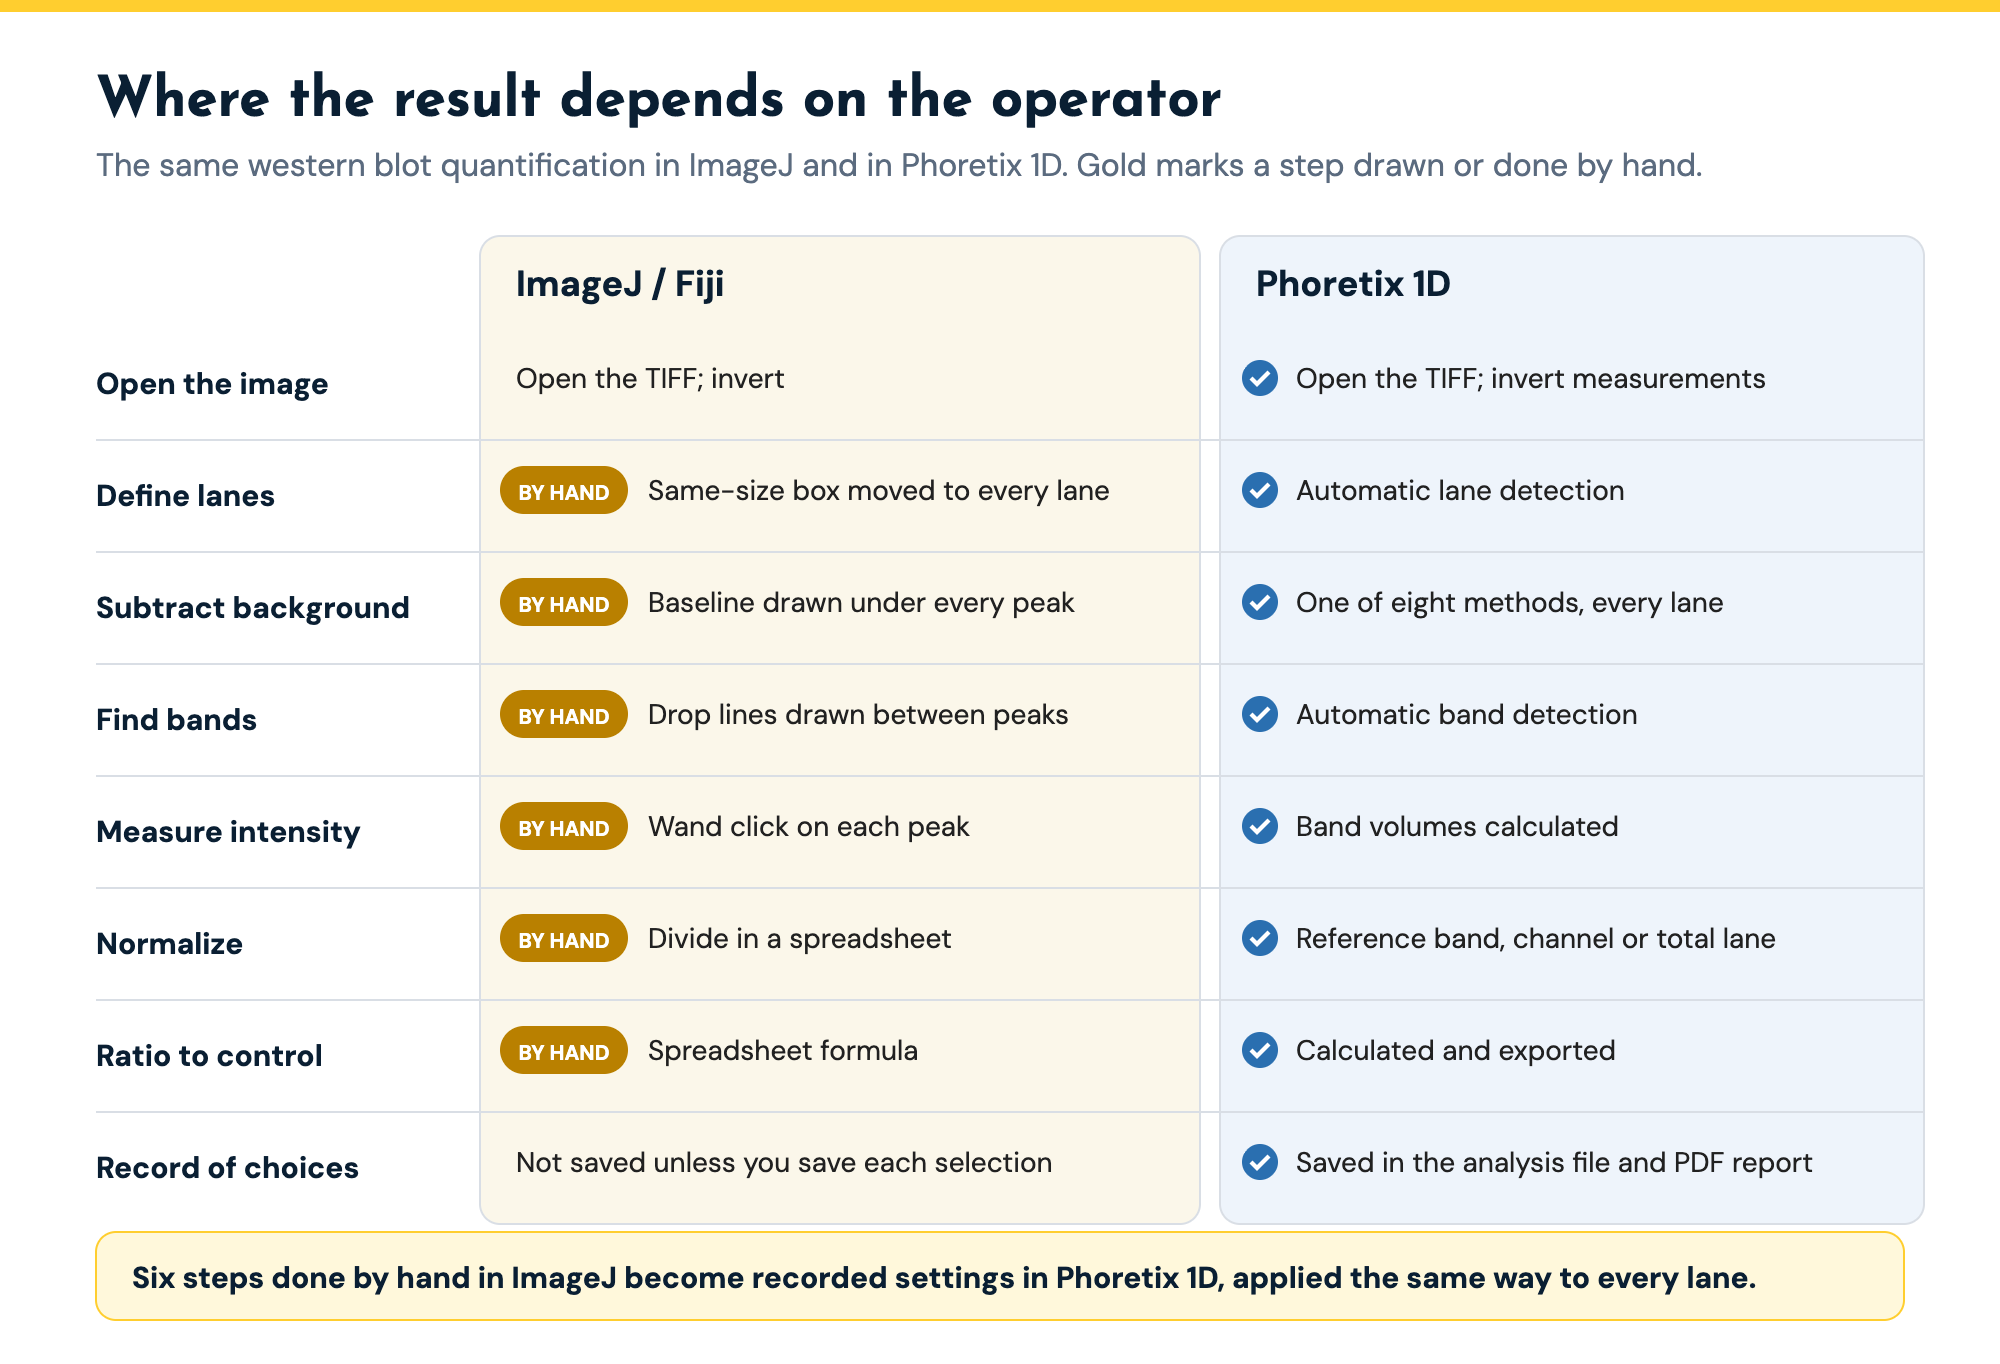
Look at steps 3 to 7 again. Each one is a decision made by hand, and none of them is stored with the result.
One box size for every lane. ImageJ’s gel tool needs every lane rectangle to be the same size, and the rectangle is straight. Lanes that smile, wander or narrow toward the bottom of the gel do not fit, so either the box clips the edge of a band or it takes in background from the next lane.
Baselines drawn by eye. The baseline under each peak decides how much of the band’s intensity counts. Draw it a little higher and the band shrinks. Two people analyzing the same blot draw different baselines and get different numbers, and the same person gets different numbers on different days. Background subtraction changes the final ratio more than any other step, which is why the densitometry guide calls background subtraction the choice that changes your number.
Saturation is easy to miss. The gel tool measures whatever pixels you give it. If the brightest band hit the detector ceiling, ImageJ will still report an area, and that area will be too small.
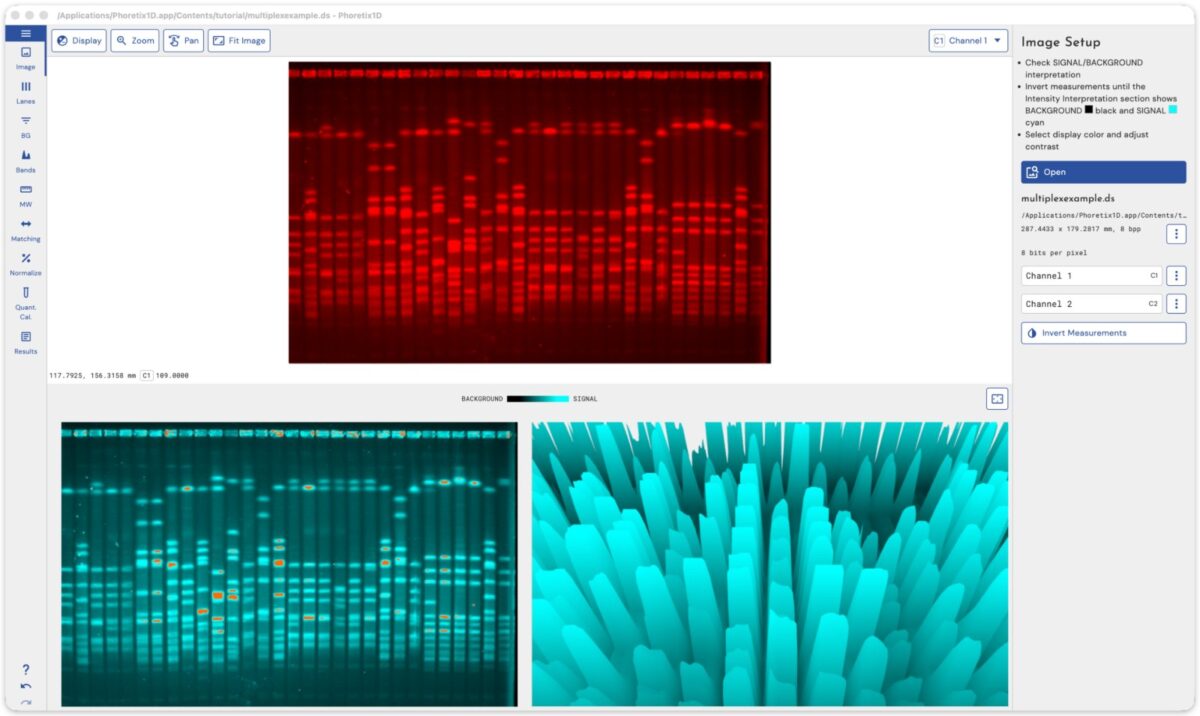
Phoretix 1D highlights saturated areas on the image and plots band intensities in 3D, so a clipped band stands out before you measure it.
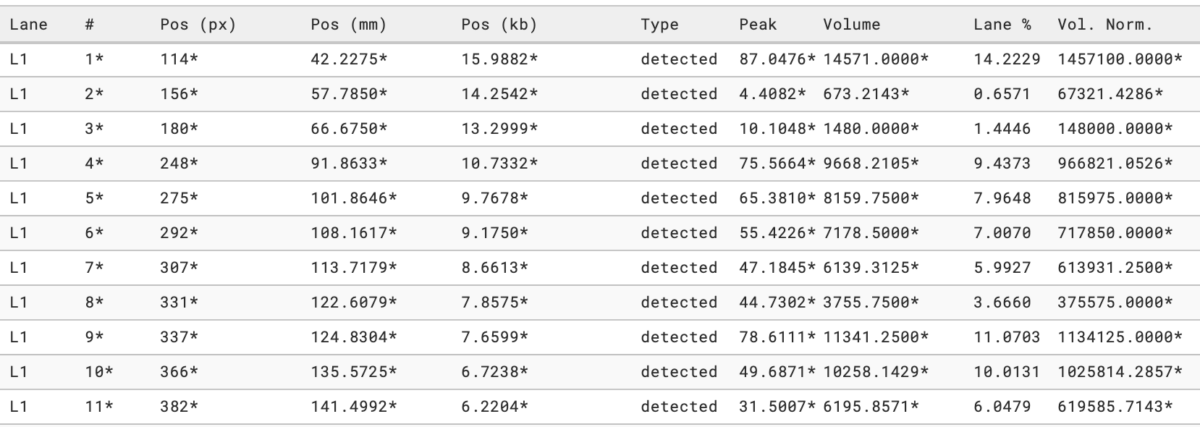
The calculation lives in a spreadsheet. ImageJ gives you peak areas, or each peak as a percentage of all the peaks you measured. Normalization, ratio to control and the statistics all happen in a separate file, with copy and paste in between.
Nothing records what you did. Unless you save every selection yourself, there is no record of where the boxes and baselines were. A reviewer who asks how the background was subtracted, or a colleague who reruns the analysis, has to start again. For regulated labs there is no audit trail, no electronic signatures and no user permissions, so ImageJ results cannot support 21 CFR Part 11.
What ImageJ does well
ImageJ is free, open source and backed by decades of community plugins and macros. It opens almost any image format and does far more than gels: cell counting, colocalization, measuring anything you can outline. For a student learning what densitometry means, drawing the baselines yourself is a good way to understand it. For a lab that runs one blot a month and has one person who always does the analysis, it may be all you need. Keep it for that work. Phoretix 1D takes over one job, gel and blot quantification, where ImageJ leaves too many decisions to the person at the mouse.
Feature comparison: Phoretix 1D vs ImageJ for western blots
| Criterion | Phoretix 1D (TotalLab) | ImageJ / Fiji |
|---|---|---|
| Price | Licensed per computer with unlimited users; support and updates included; free trial | Free and open source |
| Images | Any imager: TIFF 8-bit to 16-bit and above, multiplex TIFF, IMG, JPEG, PNG, BMP | Almost any image format |
| Operating systems | Windows 11; macOS (Intel and Apple silicon); Linux; ARM | Windows; macOS; Linux |
| Lane definition | Automatic, including distorted and empty lanes; multiple lane boxes per image; manual editing | One rectangle per lane, drawn by hand; every rectangle must be the same size |
| Band detection | Automatic with per-lane and per-channel parameters; manual add, split and remove | Peaks chosen by hand on the lane profile |
| Background subtraction | Eight methods (none, rolling ball, rubber band, constant value, profile minimum, image rectangle, lane edge, manual), set per lane and per channel | Rolling ball on the whole image (Process > Subtract Background), or baselines drawn by hand under each peak |
| Saturation check | Saturated areas highlighted; 3D view of band intensities | Not part of the gel tools |
| Band intensity | Background-corrected band volume for every band in every lane | Peak area measured with the wand tool, one click per peak |
| Normalization | Reference band, most intense band, total lane volume or housekeeping channel, built in | In a spreadsheet, by hand |
| Molecular weight | Ladder library and custom ladders; several curve fits | Not part of the gel tools |
| Record of the analysis | Settings saved in the analysis file; PDF report with recorded settings | None unless you save each selection yourself |
| Export | One-click PDF report; CSV; clipboard | Copy results to a spreadsheet |
| 21 CFR Part 11 | With AuditSafe: audit trails, electronic signatures, user permissions, image authenticity verification | No |
| Support | Unlimited technical support from the TotalLab team | Community forum |
ImageJ facts from the ImageJ user guide and documentation for Analyze > Gels and Process > Subtract Background, checked 7 October 2026. Phoretix 1D facts from totallab.com.
The same blot in both workflows
Here is what each step of a two-target, ten-lane western blot looks like in each tool.
| Step | ImageJ / Fiji | Phoretix 1D |
|---|---|---|
| Open the image | Open the TIFF; invert if needed | Open the TIFF; Invert Measurements if needed |
| Check saturation | Not in the gel tools; check on the imager | Saturated areas highlighted on the image |
| Define lanes | Draw a rectangle on lane 1, then move the same rectangle to every other lane (by hand) | Automatic lane detection; edit any lane box |
| Subtract background | Rolling ball on the whole image, or a baseline drawn under every peak (by hand) | Choose one of eight methods; applied to every lane |
| Find bands | Read peaks off each lane profile; draw drop lines between neighbors (by hand) | Automatic band detection; add, split or remove bands |
| Measure intensity | Click each peak with the wand tool (by hand) | Band volumes calculated for every band |
| Normalize | Divide by the loading control in a spreadsheet (by hand) | Pick the reference band, housekeeping channel or total lane volume |
| Ratio to control | Spreadsheet formula (by hand) | Calculated and exported |
| Repeat on the next blot | Start again | Reapply the saved settings |
Each step of a western blot quantification in ImageJ and in Phoretix 1D. Steps marked by hand in ImageJ are where results vary between operators.
Both tools measure the same quantity, integrated band intensity after background subtraction. What changes is who makes the decisions. Every judgment in the ImageJ column becomes a recorded setting in Phoretix 1D, applied identically to every lane and saved in the analysis file. That is what lets a second person, or a reviewer, get the same number. Phoretix 1D also reads the 16-bit TIFF files you already open in ImageJ, so the comparison starts from the same raw data.
When ImageJ is enough, and when it is not
Stay with ImageJ if you quantify a few blots a year, one person does all of the analysis, nobody outside the lab needs to repeat it, and the lanes run straight.
Move to dedicated software when any of these is true:
- More than one person analyzes blots, and you need their numbers to agree.
- You run several blots a week and the spreadsheet step is where the time goes.
- Your gels smile or warp, or your lanes are not evenly spaced.
- A journal or reviewer has asked how background was subtracted, or for evidence that bands were not saturated.
- You work under GMP, GLP or 21 CFR Part 11 and need an audit trail and electronic signatures.
“After having used many other software for gel image analysis, including Bio-Rad’s Image Lab and ImageJ, I started using Phoretix 1D out of necessity in a new role. I found it to be much more intuitive and streamlined than what I’ve used in the past. Background subtraction, band picking, and band analysis are all automated with optional manual adjustment if desired.”
Garry Smith, Proliant Health and Biologicals
How to compare them on your own blot
Take a blot you have already quantified in ImageJ and open the same TIFF in the Phoretix 1D free trial. Let it detect the lanes and bands, choose rolling ball background (the method closest to ImageJ’s Subtract Background), and normalize to the same loading control. Compare the ratio to control with your spreadsheet. Then ask a colleague to repeat the ImageJ analysis without looking at yours, and compare the spread. That spread is the number that matters.
Further reading:
- How western blot densitometry works, step by step
- The eight background subtraction methods in Phoretix 1D
- Western blot and gel analysis software compared: ImageJ, Image Lab, Empiria Studio, iBright and GelAnalyzer
- If you also have a Bio-Rad imager: Phoretix 1D vs Image Lab
- How to quantify a western blot, step by step
Frequently asked questions
Q: Is ImageJ good for western blot quantification?
A: ImageJ can quantify a western blot, and it is free. Its gel tools measure the area under each lane profile peak, which is the band’s integrated intensity. The weakness is reproducibility. Lane boxes, baselines and peak boundaries are all drawn by hand, so two people analyzing the same blot usually get different numbers, and nothing records the choices they made.
Q: How do you quantify a western blot in ImageJ?
A: Open the raw TIFF, draw a rectangle around the first lane and use Analyze > Gels > Select First Lane, move the same rectangle to each other lane with Select Next Lane, then Plot Lanes. Draw a baseline under each peak with the straight line tool, click inside each peak with the wand to record its area, and copy the areas into a spreadsheet to normalize to the loading control and calculate the ratio to control.
Q: Why does ImageJ give different results each time?
A: Because the results depend on where you draw the lane boxes, the baselines and the drop lines between peaks. A slightly higher baseline removes more of the band. ImageJ does not store those choices with the result, so repeating the analysis means drawing them again.
Q: Is ImageJ compliant with 21 CFR Part 11?
A: No. ImageJ has no audit trail, electronic signatures or user permissions. Phoretix 1D with TotalLab’s AuditSafe module provides audit trails, electronic signatures, granular user permissions and image authenticity verification for FDA 21 CFR Part 11 and EU Annex 11.
Q: What is the best ImageJ alternative for western blot analysis?
A: The main options are the software bundled with your imager (such as Bio-Rad Image Lab, LI-COR Empiria Studio or Thermo Fisher iBright Analysis Software), free tools such as GelAnalyzer, and independent packages such as TotalLab’s Phoretix 1D, which reads images from any imager and runs on Windows, macOS and Linux. The software comparison guide on this site compares them feature by feature.
Q: Can Phoretix 1D open the same files I use in ImageJ?
A: Yes. Phoretix 1D reads 8-bit, 16-bit and higher uncompressed TIFF, multi-page and multiplex TIFF, plus IMG, JPEG, PNG and BMP, from any imager.
Q: Is Fiji different from ImageJ for gel analysis?
A: No. Fiji is a distribution of ImageJ with extra plugins bundled, and it uses the same Analyze > Gels tools, so the steps and the limitations are the same.
Stop drawing baselines by hand
Open the TIFF you quantified in ImageJ in a free Phoretix 1D trial. Lanes, bands, background and normalization run in one pass, and the settings are saved in the analysis file so anyone can reproduce the result. Windows, macOS and Linux, any imager.
References
- Schneider CA, Rasband WS, Eliceiri KW. NIH Image to ImageJ: 25 years of image analysis. Nature Methods. 2012;9:671-675. DOI 10.1038/nmeth.2089.
(Source for: ImageJ is free, open source and widely used.) - Schindelin J, Arganda-Carreras I, Frise E, et al. Fiji: an open-source platform for biological-image analysis. Nature Methods. 2012;9:676-682. DOI 10.1038/nmeth.2019.
(Source for: Fiji is a distribution of ImageJ.) - Ferreira T, Rasband W. ImageJ User Guide, IJ 1.46r, section on Analyze > Gels. https://imagej.net/ij/docs/guide/146-30.html
(Source for: lane rectangles must have the same dimensions; Uncalibrated OD works on 8-bit images only; Label With Percentages reports each peak as a percentage of all measured peaks.) - ImageJ documentation, Analyze menu, Gels. https://imagej.net/ij/docs/menus/analyze.html
(Source for: Select First Lane, Select Next Lane and Plot Lanes; baselines and drop lines drawn with the straight line tool; peaks measured with the wand tool.) - ImageJ documentation, Process menu, Subtract Background. https://imagej.net/ij/docs/menus/process.html
(Source for: rolling ball background subtraction and the radius rule of thumb.) - Gassmann M, Grenacher B, Rohde B, Vogel J. Quantifying Western blots: pitfalls of densitometry. Electrophoresis. 2009;30(11):1845-1855. DOI 10.1002/elps.200800720.
(Source for: background subtraction and saturation as sources of error in densitometry.) - TotalLab. Phoretix 1D product page. https://totallab.com/software/1d-gel-western-blot-analysis-software/
(Source for: file formats; platforms; automatic lane and band detection; eight background methods; normalization modes; PDF and CSV export; AuditSafe; testimonial.)