Guide
DNA microarray
What it is, how it works and how to analyze the images

Guide
What it is, how it works and how to analyze the images
A DNA microarray is a glass slide, chip or membrane carrying thousands of spots, each holding a known DNA sequence (a probe). A sample’s DNA or RNA is labeled with a fluorescent dye and washed over the array; each labeled molecule sticks (hybridizes) to the spot with its complementary sequence. After washing, a scanner images the array, and the brightness of each spot shows how much of that sequence was in the sample. That is how one experiment measures the expression of thousands of genes at once.
This guide explains how a microarray works step by step, the main types, what the results can and cannot tell you, how a microarray compares with RNA-seq, and how the scanned image is turned into numbers.
On this page
| Step | What happens | What can go wrong | Check before moving on |
|---|---|---|---|
| 1. Array design | Probes chosen for the genes or regions you need | Probes missing or binding related sequences | The array covers your targets |
| 2. Sample and RNA | RNA extracted from each sample | Degraded or contaminated RNA | RNA quality and quantity |
| 3. Labeling | RNA copied to cDNA or cRNA and labeled with a fluorescent dye | Low or uneven labeling | Labeling yield; for two-color, both dyes |
| 4. Hybridization | Labeled target binds its complementary probes | Uneven hybridization, drying, bubbles | Even signal across the array |
| 5. Washing | Loosely or wrongly bound target removed | High background, or signal washed off | Background level in the scan |
| 6. Scanning | Each dye imaged as its own channel | Saturated spots, or too little signal | No saturated spots you need to measure |
| 7. Image analysis | Grid placed, spots found, intensities measured, background subtracted | Misplaced grid, dust, smears, merged spots | Grid fit and flagged spots |
| 8. Normalization and statistics | Dye and array effects removed, samples compared | Dye bias left in, too few replicates | Normalized ratios centered; replicates agree |
The steps of a typical gene expression microarray experiment, what each one does, and what to check before moving on.
A DNA microarray, also called a DNA chip or gene chip, is a solid surface carrying an ordered grid of spots. Each spot holds many copies of one known DNA sequence, the probe. The sample being measured, the target, is labeled and hybridized to the array, and each probe captures its complementary sequence.
Two inventions made the method. In 1991, Stephen Fodor and colleagues showed that light-directed chemistry could build large, spatially addressable arrays of molecules on a surface (ref 1). In 1995, Mark Schena and colleagues printed complementary DNAs (cDNAs) on glass with a robot and measured the expression of 45 Arabidopsis genes at once by two-color fluorescence hybridization (ref 2). A year later, Lockhart and colleagues used high-density arrays of synthetic oligonucleotides to detect RNAs present at 1 in 300,000 and quantify them over more than three orders of magnitude (ref 3).
Array or assay? The array is the format: the grid of probes. The assay is the test you run on it: hybridizing a sample and measuring the signal. A “microarray assay” is an assay carried out on a microarray.
| Type | What is on the spots | Read as | Typical use |
|---|---|---|---|
| Spotted cDNA array | PCR products or cDNAs printed on glass | Two-color ratio of two samples on one array | Gene expression comparisons |
| In situ oligonucleotide array | Short synthetic oligonucleotides built on the chip | One color, one sample per array | Whole-transcriptome expression |
| Array CGH | Mapped genomic DNA sequences | Two-color ratio of test to reference DNA | Copy number gains and losses |
| SNP genotyping array | Probes for known variant sites | Allele-specific signal | Genotyping and association studies |
| Protein and antibody arrays | Antibodies or proteins on a membrane or slide | Spot intensity, read like a dot blot | Cytokine and protein profiling |
The main types of DNA and related microarrays, what is on the spots, what each measures and what each is used for.
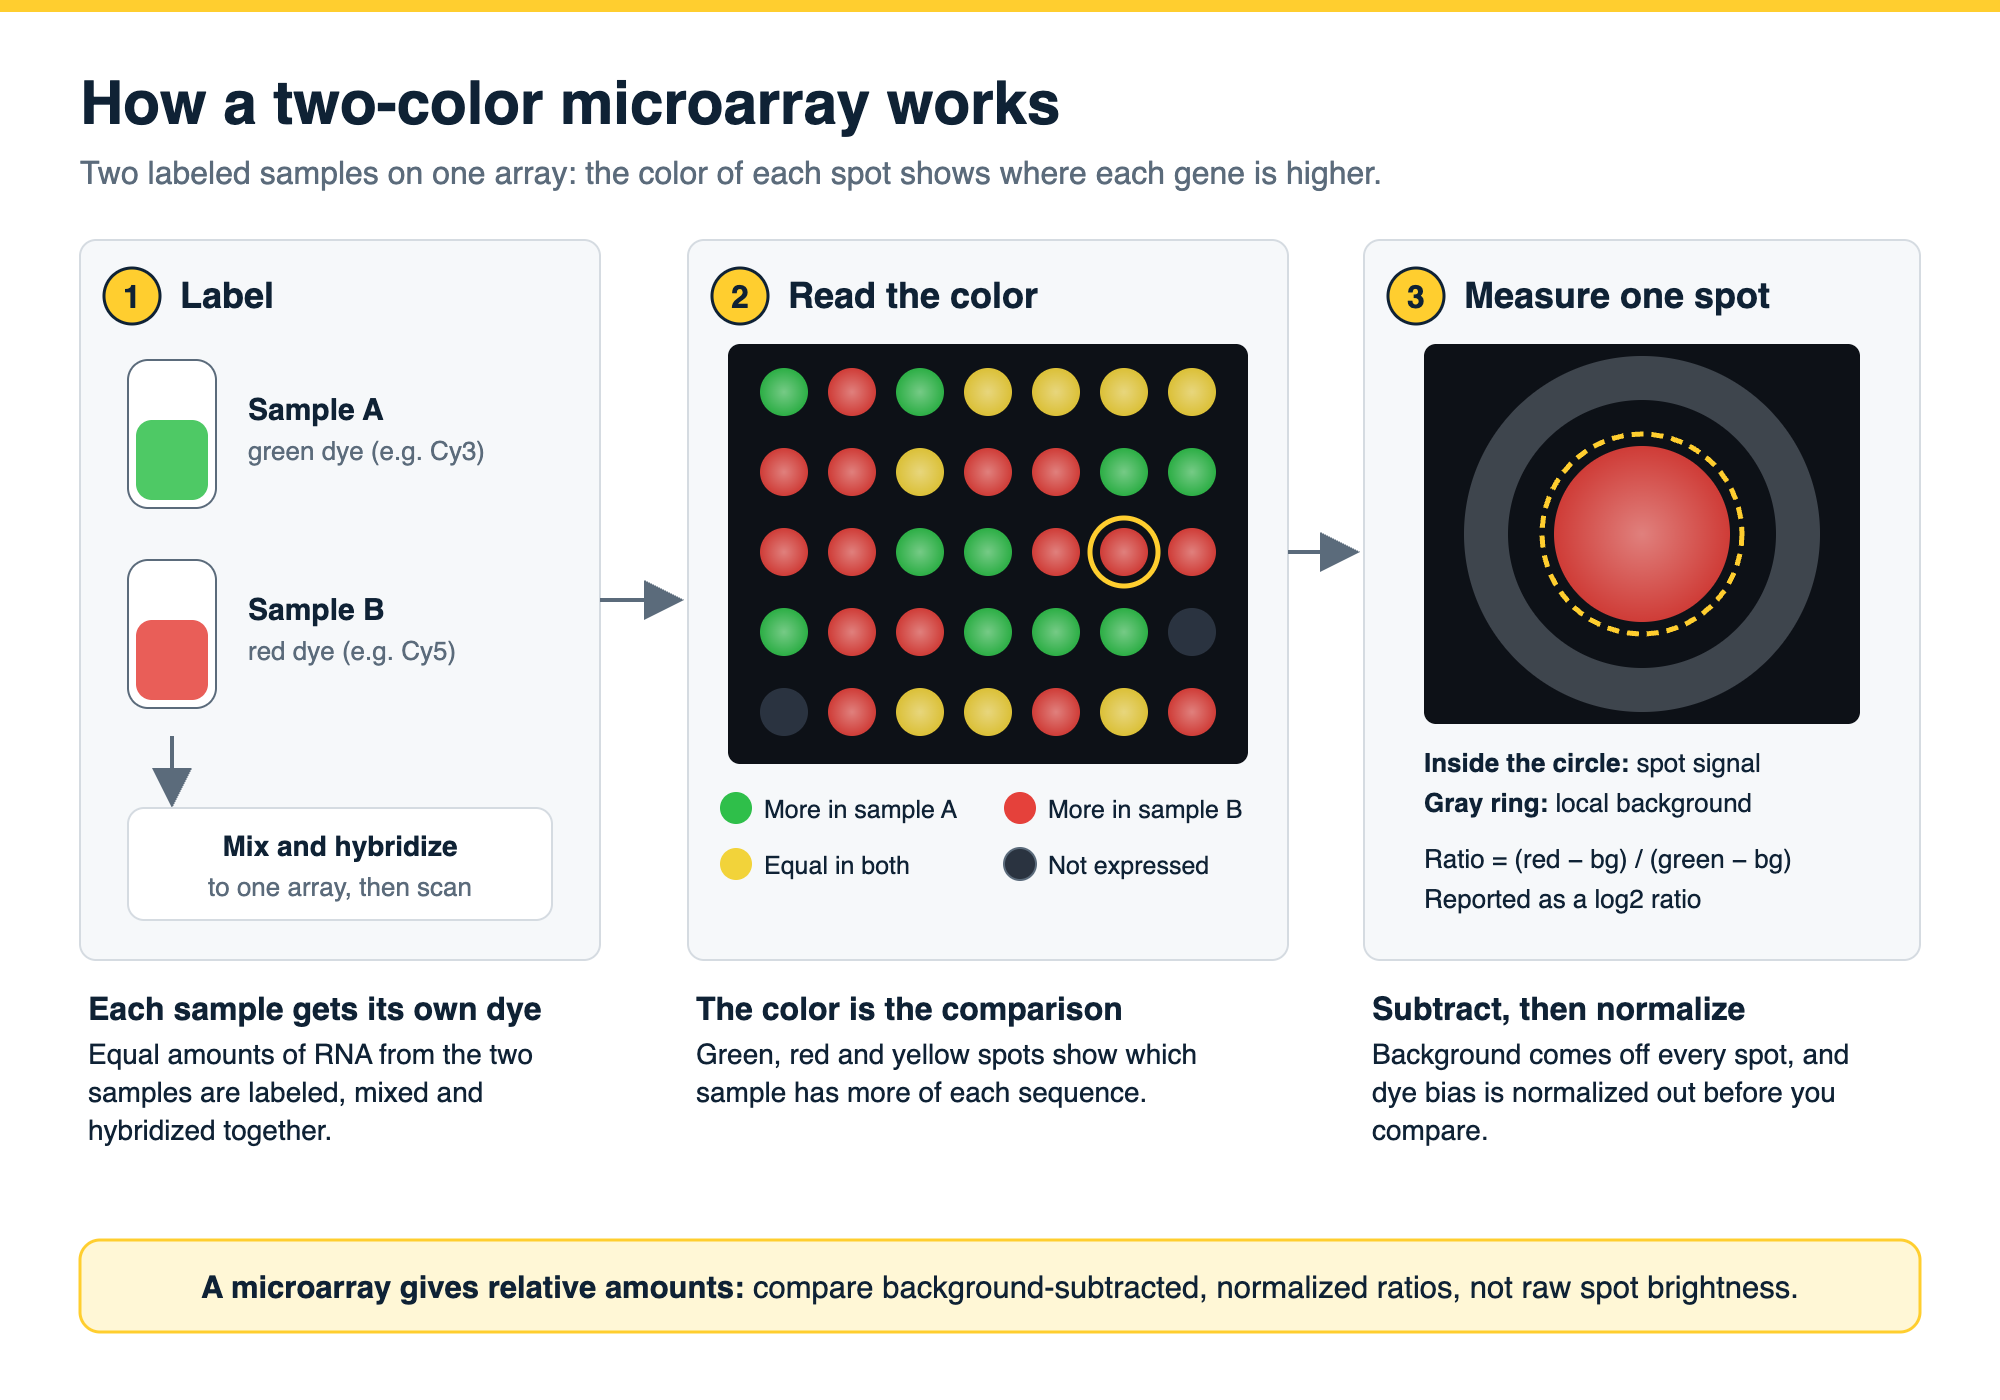
Spotted cDNA arrays are usually read with two colors: each spot gives a ratio of one sample against the other (ref 2). In situ synthesized oligonucleotide arrays are usually read with one color: each array measures one sample, and samples are compared after normalization across arrays (refs 3, 6). Array comparative genomic hybridization (array CGH) uses the same two-color principle on genomic DNA: the ratio of test to reference DNA at each spot tracks copy number, which is how it maps deletions and amplifications (ref 7).
The same idea, a grid of capture spots read as an image, is used for proteins too: antibody and cytokine arrays are membrane or slide arrays read in the same way as a dot blot.
A microarray measures relative abundance. A spot’s brightness reflects how much labeled target bound to it, so the useful result is a comparison: gene A is higher in the treated sample than in the control, or region B has fewer copies in the tumor than in normal tissue. It does not give an absolute number of molecules without calibration.
From a gene expression experiment you can conclude which genes changed between conditions, by how much (usually reported as a log2 ratio or fold change), and which genes change together. Two caveats apply. First, a microarray only measures the sequences its probes were designed for, so it cannot find new transcripts. Second, probes can bind related sequences (cross-hybridization), and very weak and very strong signals fall outside the range a probe can measure (ref 8). Results for key genes are therefore often confirmed by another method.
Microarrays can be reproducible. In the MicroArray Quality Control (MAQC) project, coordinated by US FDA scientists, the same RNA samples run at multiple sites gave consistent results within each platform and largely agreed across platforms on which genes were differentially expressed (ref 9).
Every microarray result starts as an image, and the image analysis decides what the numbers mean.
Gridding and spot finding. The software places a grid over the array layout and then finds the edge of each spot, so that every spot is measured over the area it actually covers.
Intensity and background. The signal of a spot is its intensity minus the background around it. Background comes from nonspecific binding and uneven fluorescence across the slide. Simply subtracting a local background estimate can produce negative values and noisy ratios for weak spots; model-based background correction performs better in comparisons (ref 10).
Quality flags. Saturated spots, dust, scratches, smears and spots that merge with their neighbors should be flagged and excluded rather than measured.
Normalization. Dyes label and fluoresce with different efficiencies, and arrays differ in overall brightness. Normalization removes these technical effects before samples are compared. On two-color arrays, a single global correction is not enough when the dye bias changes with spot intensity or position on the slide; intensity-dependent (loess) normalization addresses this (refs 4, 5). On one-color oligonucleotide arrays, normalization is done across arrays (ref 6).
Reporting. The MIAME guidelines (Minimum Information About a Microarray Experiment) set out what to report so others can interpret and verify the data, including the array design, the samples, the hybridization, the measurements and the normalization (ref 11).
RNA-seq sequences the RNA in a sample instead of hybridizing it to probes. In a direct comparison on the same samples, the two methods gave highly correlated expression profiles, but RNA-seq detected more low-abundance transcripts, distinguished isoforms, identified genetic variants and had a broader dynamic range, because it does not depend on pre-designed probes (ref 8). The same study noted why microarrays remained in wide use: lower cost, simpler data storage and simpler analysis (ref 8).
Choose a microarray when the sequences you need are known, the sample numbers are large and the analysis needs to be simple and established. Choose RNA-seq when you need to discover new transcripts, isoforms or variants, or measure very low or very high expression.
Phoretix Array is TotalLab’s software for quantifying array and plate images you capture yourself: DNA and RNA microarrays, cytokine array membranes, dot blots, slot blots, and ELISpot and FluoroSpot plates (ref 12). It handles the image analysis steps above in one place:
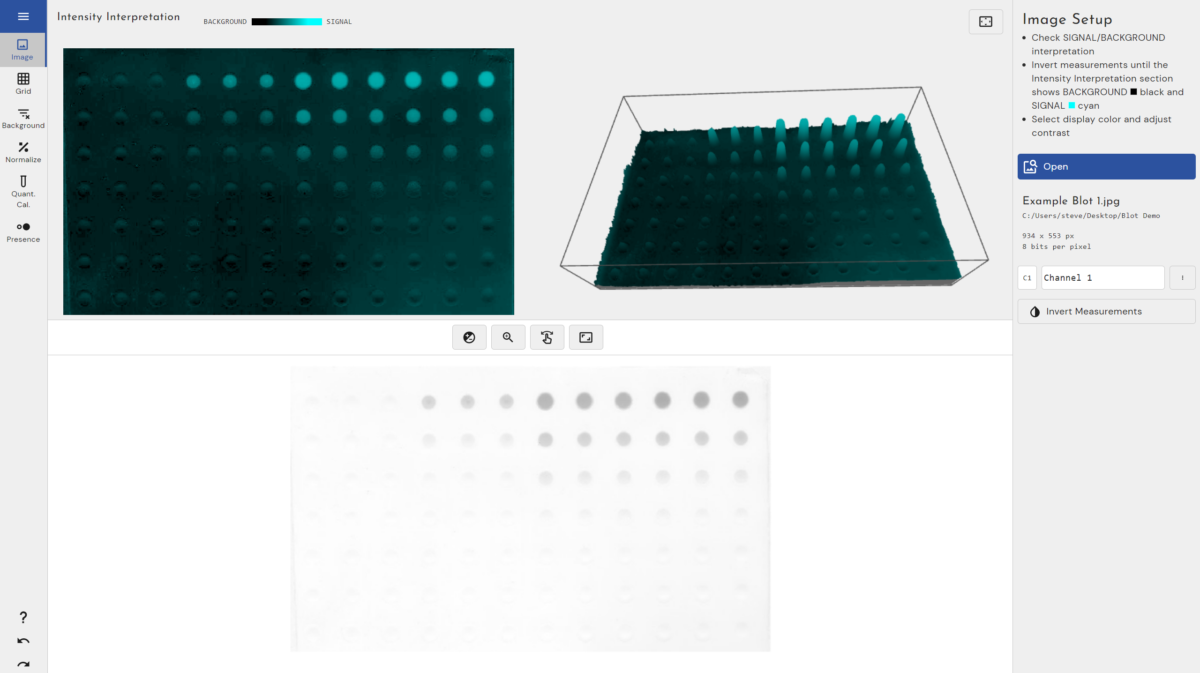
Phoretix Array reads TIFF (including multichannel TIFFs, such as two-color Cy3/Cy5 scans), IMG, JPEG, PNG and BMP images from fluorescence, chemiluminescence and colorimetric detection, measures directly from the raw image, runs on Windows, macOS and Linux, and returns results in under a minute per image. With AuditSafe it adds audit trails, electronic signatures and image authenticity checks for 21 CFR Part 11 and EU Annex 11 (ref 12).
For whole-genome commercial chips, analysis normally runs in the platform’s own software and statistical packages, starting from the scanner’s output files (ref 6). Phoretix Array is for arrays where you have the image and need the spot values from it.
For membrane and antibody arrays read like dot blots, see the dot blot protocol.
If you quantified with Phoretix Array, the methods sentence reads: “Spot intensities were quantified using Phoretix Array (TotalLab Ltd, Newcastle upon Tyne, UK) after background subtraction and normalized to the [reference/positive control] spots.” Replace the bracketed part with the controls on your array (ref 12).
The video below runs the full Phoretix Array workflow on a spot array: fitting the grid, each background method, control spots, normalization, a calibration curve, presence and absence, and a saved template for the next image.

Open one of your own array images in a free Phoretix Array trial: fit the grid once, subtract background, normalize to your control spots and export the values.
A: A glass slide, chip or membrane carrying thousands of spots of known DNA sequences (probes). A labeled sample is hybridized to it, each labeled molecule binds its complementary probe, and the brightness of each spot after scanning shows how much of that sequence was in the sample.
A: RNA from each sample is copied and labeled with a fluorescent dye, hybridized to probes for each gene, and scanned. The more RNA a gene produced, the brighter its spot. Comparing spot intensities between samples, after background subtraction and normalization, shows which genes changed.
A: The array is the format: an ordered grid of probes or capture spots. The assay is the test run on it: applying a sample and measuring the signal. A microarray assay is an assay carried out on a microarray.
A: On a two-color array, two samples labeled with different dyes, often Cy3 and Cy5, are hybridized to the same array and each spot gives a ratio. On a one-color array, each sample goes on its own array and samples are compared after normalization across arrays.
A: Which genes or regions differ between samples, in which direction and by how much, and which change together. A microarray gives relative, not absolute, amounts, only for the sequences its probes were designed to detect, so key results are often confirmed by another method.
A: For discovery, often yes: RNA-seq detects more low-abundance transcripts, isoforms and variants and has a broader dynamic range. Microarrays remain useful where the target sequences are known and sample numbers are large, because they cost less and the data are simpler to store and analyze.
A: Normalization removes technical differences between dyes and between arrays before samples are compared. On two-color arrays, intensity-dependent methods such as loess correct dye bias that changes with spot brightness or position; on one-color arrays, normalization is done across all the arrays in the study.